well maintained 4 flat
Active
$479,900
1044 W 48th St, Chicago, IL 60609
9beds
--sqft
Multi Family
Built in 1883
-- sqft lot
$471,500 Zestimate®
$--/sqft
$-- HOA
What's special
- 13 days
- 87
- 0
Zillow last checked:
Listing updated:
Listed by:
Francisco Diaz 773-622-9930,
Diaz Homes Realty
Source: MRED as distributed by MLS GRID,MLS#: 12789063
Facts & features
Interior
Bedrooms & bathrooms
- Bedrooms: 9
- Bathrooms: 4
- Full bathrooms: 4
Heating
- Forced Air
Features
- Basement: Unfinished,Full
Property
Parking
- Total spaces: 2
- Parking features: Yes, Garage Owned, Detached, Garage
- Garage spaces: 2
Lot
- Size: 3,125 Square Feet
- Dimensions: 25X125
Details
- Parcel number: 20082030300000
- Special conditions: None
Construction
Type & style
- Home type: MultiFamily
- Property subtype: Multi Family
Materials
- Vinyl Siding
Condition
- New construction: No
- Year built: 1883
Utilities & green energy
- Sewer: Public Sewer
- Water: Lake Michigan
Community & HOA
Location
- Region: Chicago
Financial & listing details
- Tax assessed value: $310,000
- Annual tax amount: $6,228
- Date on market: 10/20/2026
- Ownership: Fee Simple
Estimated market value
$471,500
$448,000 - $495,000
$1,746/mo
Price history
| Date | Event | Price |
|---|---|---|
| 10/20/2026 | Listed for sale | $479,900+37.1% |
Source:  MRED as distributed by MLS GRID #12789063 Report a problem | ||
| 9/26/2023 | Sold | $350,000+0% |
Source: MRED as distributed by MLS GRID #11820407 Report a problem | ||
| 7/29/2023 | Contingent | $349,900 |
Source: MRED as distributed by MLS GRID #11820407 Report a problem | ||
| 6/29/2023 | Listed for sale | $349,900+629% |
Source: MRED as distributed by MLS GRID #11820407 Report a problem | ||
| 5/3/2017 | Sold | $48,000+6.7% |
Source: MRED as distributed by MLS GRID #09400527 Report a problem | ||
| 4/13/2017 | Pending sale | $45,000 |
Source: Amerimax Real Estate Partners #09400527 Report a problem | ||
| 4/4/2017 | Price change | $45,000-30.8% |
Source: Amerimax Real Estate Partners #09400527 Report a problem | ||
| 3/14/2017 | Listed for sale | $65,000 |
Source: Amerimax Real Estate Partners #09400527 Report a problem | ||
| 12/6/2016 | Pending sale | $65,000 |
Source: Amerimax Real Estate Partners #09400527 Report a problem | ||
| 12/6/2016 | Listed for sale | $65,000 |
Source: Amerimax Real Estate Partners #09400527 Report a problem | ||
| 11/5/2016 | Listing removed | $65,000 |
Source: Amerimax Real Estate Partners #09216979 Report a problem | ||
| 7/21/2016 | Listed for sale | $65,000 |
Source: Amerimax Real Estate Partners #09216979 Report a problem | ||
| 7/14/2016 | Pending sale | $65,000 |
Source: Amerimax Real Estate Partners #09216979 Report a problem | ||
| 5/5/2016 | Listed for sale | $65,000+8.3% |
Source: Amerimax Real Estate Partners #09216979 Report a problem | ||
| 5/19/2010 | Sold | $60,000+233.3% |
Source: Public Record Report a problem | ||
| 9/23/2009 | Sold | $18,000-85% |
Source: Public Record Report a problem | ||
| 6/6/2005 | Sold | $120,000+344.4% |
Source: Public Record Report a problem | ||
| 3/20/2000 | Sold | $27,000 |
Source: Public Record Report a problem | ||
Public tax history
| Year | Property taxes | Tax assessment |
|---|---|---|
| 2024 | $6,228 +195.2% | $31,000 +210% |
| 2023 | $2,110 +2.6% | $10,000 |
| 2022 | $2,057 +2.3% | $10,000 |
| 2021 | $2,011 +4.4% | $10,000 +15.6% |
| 2020 | $1,926 -4.6% | $8,647 -14% |
| 2019 | $2,020 +1.7% | $10,055 |
| 2018 | $1,986 -34.5% | $10,055 -28.6% |
| 2017 | $3,033 +7.5% | $14,090 |
| 2016 | $2,822 +9.3% | $14,090 |
| 2015 | $2,582 -3.4% | $14,090 -2.2% |
| 2014 | $2,673 +2% | $14,406 |
| 2013 | $2,620 +1.4% | $14,406 |
| 2012 | $2,585 -21.4% | $14,406 -29% |
| 2011 | $3,288 -0.4% | $20,291 |
| 2010 | $3,302 +4.4% | $20,291 |
| 2009 | $3,164 +20.2% | $20,291 +10.6% |
| 2008 | $2,633 +1% | $18,353 |
| 2007 | $2,607 -1.1% | $18,353 |
| 2006 | $2,635 +41.4% | $18,353 +60.9% |
| 2005 | $1,864 +1% | $11,405 |
| 2004 | $1,845 +2.2% | $11,405 |
| 2003 | $1,805 +60.6% | $11,405 +82.4% |
| 2002 | $1,123 +3.7% | $6,253 |
| 2001 | $1,083 +11.6% | $6,253 |
| 2000 | $970 -0.7% | $6,253 +23.8% |
| 1999 | $977 | $5,051 |
Find assessor info on the county website
Monthly payment
Est. payment
Payment breakdown
Explore the cost of this home by adjusting the details. Changes won't be saved.Climate risks
Neighborhood: Back of the Yards
Nearby schools


Similar homes
- $449,50011 bd3 ba-- sqft4813 S Racine Ave, Chicago, IL 60609Active
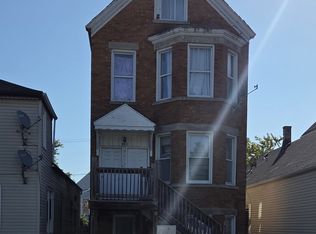 MLS ID #12753148, Relu Ciobanu, Kale Realty. MRED as distributed by MLS GRID
- $479,0008 bd4 ba-- sqft1314 W 51st St, Chicago, IL 60609Re-activated
 MLS ID #12688579, Juan Loza, American International Realty. MRED as distributed by MLS GRID
- $399,0008 bd4 ba-- sqft4812 S Elizabeth St, Chicago, IL 60609Active
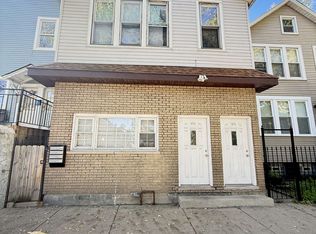 MLS ID #12757721, Mago Chacon, Century 21 S.G.R., Inc.. MRED as distributed by MLS GRID
- $540,0009 bd3 ba-- sqft5115 S California Ave, Chicago, IL 60632New
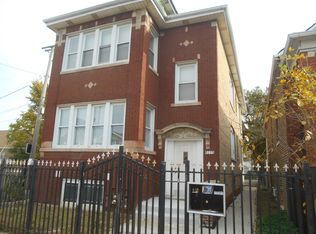 MLS ID #12798865, David J Padgurskis, Showtime Realty, Inc.. MRED as distributed by MLS GRID
