**Investment Opportunity -Explore the potential of this multifamily investment property. Land contract financing is available with 10% down, monthly payments of $1,000, and 6% interest, with repayment terms adjusted accordingly over a 63-month period. All financing terms are subject to seller approval and mutual agreement. Buyer and buyer's agent to verify all information, including lot dimensions, zoning, utility availability, permitted uses, and building requirements with the City.
Active
$70,000
1053 Union Ave, Benton Harbor, MI 49022
4beds
2baths
700sqft
2 to 4 Units
Built in 1930
-- sqft lot
$110,100 Zestimate®
$100/sqft
$-- HOA
What's special
- 3 days
- 129
- 1
Zillow last checked:
Listing updated:
Listed by:
Jennell Robinson 269-330-8727,
Lockett-Jones Realty Group 269-720-5182
Source: MichRIC,MLS#: 26059690
Facts & features
Interior
Bedrooms & bathrooms
- Bedrooms: 4
- Bathrooms: 2
Heating
- Space Heater
Features
- Basement: Michigan Basement
Interior area
- Total interior livable area: 700 sqft
Property
Parking
- Total spaces: 2
Lot
- Size: 6,098 Square Feet
- Dimensions: 50 x 125
- Features: Sidewalk
Details
- Parcel number: 115313000055001
Construction
Type & style
- Home type: MultiFamily
- Property subtype: 2 to 4 Units
Materials
- Aluminum Siding
- Roof: Composition
Condition
- New construction: No
- Year built: 1930
Utilities & green energy
- Sewer: Public Sewer, Storm Sewer
- Utilities for property: Natural Gas Available, Electricity Available, Cable Available, Natural Gas Connected, Electricity Connected, Cable Connected
Community & HOA
Location
- Region: Benton Harbor
Financial & listing details
- Price per square foot: $100/sqft
- Tax assessed value: $10,261
- Annual tax amount: $1,000
- Date on market: 11/11/2026
- Listing terms: Cash
- Tenant pays: Electricity, Gas
- Electric utility on property: Yes
- Road surface type: Paved
Estimated market value
$110,100
$81,000 - $140,000
$1,072/mo
Price history
| Date | Event | Price |
|---|---|---|
| 11/11/2026 | Listed for sale | $70,000+900%$100/sqft |
Source:  MichRIC #26059690 Report a problem | ||
| 5/14/2018 | Sold | $7,000$10/sqft |
Source: Public Record Report a problem | ||
| 6/14/2017 | Sold | $7,000-53%$10/sqft |
Source: MichRIC #16059513 Report a problem | ||
| 6/21/2009 | Listing removed | $14,900$21/sqft |
Source: iHOUSEWeb Solutions, Inc #2841575 Report a problem | ||
| 3/8/2009 | Listed for sale | $14,900$21/sqft |
Source: iHOUSEWeb Solutions, Inc #2841575 Report a problem | ||
Public tax history
| Year | Property taxes | Tax assessment |
|---|---|---|
| 2025 | $745 +172.4% | $28,400 +15.9% |
| 2024 | $273 | $24,500 +46.7% |
| 2023 | -- | $16,700 +38% |
| 2022 | $642 | $12,100 +1.7% |
| 2021 | -- | $11,900 |
| 2020 | $543 -58.4% | $11,900 +17.8% |
| 2019 | $1,305 +39.5% | $10,100 +2% |
| 2018 | $936 -3.5% | $9,900 +5.3% |
| 2017 | $969 +70.7% | $9,400 -1.1% |
| 2016 | $568 -7.7% | $9,500 +4.4% |
| 2015 | $616 | $9,100 -17.3% |
| 2014 | -- | $11,000 +8.9% |
| 2013 | -- | $10,100 -12.9% |
| 2012 | -- | $11,600 +19.6% |
| 2011 | -- | $9,700 -14.9% |
| 2010 | -- | $11,400 +3.6% |
| 2009 | -- | $11,000 -52.8% |
| 2008 | -- | $23,300 +10.4% |
| 2007 | -- | $21,100 +23.4% |
| 2006 | -- | $17,100 +11% |
| 2005 | -- | $15,400 +4.8% |
| 2004 | -- | $14,700 +2.8% |
| 2003 | -- | $14,300 -7.1% |
| 2002 | -- | $15,400 +0.7% |
| 2001 | -- | $15,300 |
Find assessor info on the county website
Monthly payment
Est. payment
Payment breakdown
Explore the cost of this home by adjusting the details. Changes won't be saved.Climate risks
Neighborhood: 49022
Similar homes
- $74,9003 bd2 ba850 sqft185 Hastings Ave, Benton Harbor, MI 49022For Sale

 MLS ID #26051448, Ryan F Katowich, Realty Executives Instant Equity. MichRIC
- $70,0002 bd1 ba945 sqft411 N Fair Ave, Benton Harbor, MI 49022For Sale
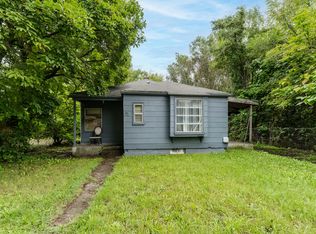 MLS ID #26050679, Jaime Cervantes, Jaqua Realtors. MichRIC
- $69,0002 bd1 ba1k sqft1980 Hatch Ave, Benton Harbor, MI 49022For Sale
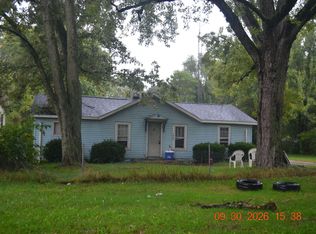 MLS ID #26052587, Brian Brant, Sunrise Real Estate, Inc.. MichRIC
- $85,0002 bd1 ba876 sqft222 Searles Ave, Benton Harbor, MI 49022For Sale
 MLS ID #26058584, Brian Newton, Sunrise Real Estate, Inc.. MichRIC
- $65,0001 bd1 ba728 sqft1354 Hurd Ave, Benton Harbor, MI 49022For SaleMLS ID #26030721, Charles Campbell, ListWithFreedom.com. MichRIC
- $89,9003 bd1 ba752 sqft1969 Hatch Ave, Benton Harbor, MI 49022For Sale
 MLS ID #50225874, Colton Rine, Five Star Real Estate. MiRealSource
- $94,9002 bd6 ba813 sqft1339 Jennings Ave, Benton Harbor, MI 49022For SaleMLS ID #26051449, Ryan F Katowich, Realty Executives Instant Equity. MichRIC
- $94,9002 bd1 ba728 sqft1541 Reeder Ave, Benton Harbor, MI 49022For SaleMLS ID #26047524, Martin George Lopez, Cressy & Everett Real Estate. MichRIC
- $44,9001 bd1 ba559 sqft434 S McCord St, Benton Harbor, MI 49022For SaleMLS ID #26049073, R.Scott Neumann, Sunrise Real Estate, Inc.. MichRIC
- $75,0002 bd1 ba828 sqft3896 Main St, Riverside, MI 49084For SaleMLS ID #26057685, Cheyenne Chernugel, The Shore Real Estate Group. MichRIC
- $98,0001 bd1 ba572 sqft363 Searles Ave, Benton Harbor, MI 49022For SaleMLS ID #26047335, Daniel Graffenius, The Shore Real Estate Group. MichRIC
- $35,0002 bd1 ba825 sqft490 4th St, Benton Harbor, MI 49022For SaleMLS ID #26030813, Charles Campbell, ListWithFreedom.com. MichRIC
