Excellent opportunity to own a duplex in great condition at 10530 SW 183rd St! Featuring 8 bedrooms and 4 bathrooms total, with a spacious 4-bedroom, 2-bathroom layout on each side. One unit is vacant and ready for occupancy or leasing; the other is currently leased for $3,500/month through Section 8. Live in one side while collecting rental income from the other, or lease both units to expand your investment portfolio. Convenient South Miami-Dade location with access to US-1 and the Florida Turnpike, shopping and dining at Southland Mall, recreation at West Perrine Park, and entertainment at the Dennis C. Moss Cultural Arts Center. A compelling combination of space, existing rental income, and flexibility!
Accepting backups
$900,000
10530 SW 183rd St, Miami, FL 33157
8beds
4baths
3,032sqft
Duplex
Built in 2006
-- sqft lot
$-- Zestimate®
$297/sqft
$-- HOA
What's special
- 39 days
- 107
- 7
Likely to sell faster than
Zillow last checked:
Listing updated:
Listed by:
Winfer Quezada realtorwinfer@gmail.com,
Pro Real Estate Group Inc
Source: MIAMI,MLS#: A12104204 Originating MLS: A-Miami Association of REALTORS
Facts & features
Interior
Bedrooms & bathrooms
- Bedrooms: 8
- Bathrooms: 4
Heating
- Central
Cooling
- Central Air
Features
- Flooring: Tile
Interior area
- Total structure area: 3,032
- Total interior livable area: 3,032 sqft
Video & virtual tour
Property
Parking
- Total spaces: 4
Features
- Stories: 1
Lot
- Features: 1/4 To Less Than 1/2 Acre Lot
Details
- Parcel number: 3050320160190
- Zoning: 3050
Construction
Type & style
- Home type: MultiFamily
- Property subtype: Duplex
Materials
- Concrete Block Construction
- Roof: Shingle
Condition
- Year built: 2006
Utilities & green energy
- Sewer: Public Sewer
Community & HOA
Community
- Subdivision: Rosehaven
HOA
- Has HOA: No
Location
- Region: Miami
Financial & listing details
- Price per square foot: $297/sqft
- Tax assessed value: $646,128
- Annual tax amount: $11,833
- Date on market: 10/9/2026
- Listing terms: All Cash,Conventional,FHA 203K
Estimated market value
Not available
Estimated sales range
Not available
Not available
Price history
| Date | Event | Price |
|---|---|---|
| 10/9/2026 | Listed for sale | $900,000+44%$297/sqft |
Source:  MIAMI #A12104204 Report a problem | ||
| 6/2/2022 | Sold | $625,000-3.8%$206/sqft |
Source: MIAMI #A11166420 Report a problem | ||
| 5/2/2022 | Contingent | $650,000$214/sqft |
Source: MIAMI #A11166420 Report a problem | ||
| 4/28/2022 | Listed for sale | $650,000-13.3%$214/sqft |
Source: MIAMI #A11166420 Report a problem | ||
| 3/17/2022 | Contingent | $749,999$247/sqft |
Source: MIAMI #A11166420 Report a problem | ||
| 2/26/2022 | Listed for sale | $749,999+127.3%$247/sqft |
Source: MIAMI #A11166420 Report a problem | ||
| 3/29/2019 | Listing removed | $2,200$1/sqft |
Source: Go Section8 Report a problem | ||
| 2/19/2019 | Price change | $2,200+2.3%$1/sqft |
Source: Go Section8 Report a problem | ||
| 1/3/2019 | Listed for rent | $2,150-2.3%$1/sqft |
Source: Go Section8 Report a problem | ||
| 2/19/2018 | Listing removed | $2,200$1/sqft |
Source: Go Section8 Report a problem | ||
| 1/18/2018 | Price change | $2,200-4.3%$1/sqft |
Source: Go Section8 Report a problem | ||
| 12/17/2017 | Price change | $2,300-4.2%$1/sqft |
Source: Go Section8 Report a problem | ||
| 12/12/2017 | Sold | $330,000+32%$109/sqft |
Source: Public Record Report a problem | ||
| 12/5/2017 | Listed for rent | $2,400$1/sqft |
Source: Go Section8 Report a problem | ||
| 10/8/2017 | Listing removed | $2,400$1/sqft |
Source: Zillow Rental Manager Report a problem | ||
| 9/8/2017 | Price change | $2,400+20%$1/sqft |
Source: Zillow Rental Manager Report a problem | ||
| 7/11/2017 | Listed for rent | $2,000$1/sqft |
Source: Zillow Rental Manager Report a problem | ||
| 3/13/2017 | Sold | $250,000+38.8%$82/sqft |
Source: Public Record Report a problem | ||
| 5/30/2016 | Listing removed | $2,000+33.3%$1/sqft |
Source: Owner Report a problem | ||
| 3/2/2016 | Listed for rent | $1,500 |
Source: Owner Report a problem | ||
| 9/8/2015 | Listing removed | $1,500 |
Source: FUSION REAL ESTATE TEAM Report a problem | ||
| 8/31/2015 | Listed for rent | $1,500 |
Source: Fusion Real Estate Team Report a problem | ||
| 3/26/2015 | Sold | $180,100+2670.8%$59/sqft |
Source: Public Record Report a problem | ||
| 6/2/1993 | Sold | $6,500$2/sqft |
Source: Public Record Report a problem | ||
Public tax history
| Year | Property taxes | Tax assessment |
|---|---|---|
| 2025 | $12,379 -0.6% | $646,128 -0.7% |
| 2024 | $12,460 +8.5% | $650,832 +7.2% |
| 2023 | $11,486 +33.6% | $607,332 +65.7% |
| 2022 | $8,599 +16.6% | $366,487 +10% |
| 2021 | $7,376 +5.8% | $333,170 +10% |
| 2020 | $6,970 +9.7% | $302,882 +10% |
| 2019 | $6,353 +20.3% | $275,348 +10% |
| 2018 | $5,278 | $250,317 -12.4% |
| 2017 | $5,278 -12.7% | $285,767 +10% |
| 2016 | $6,049 +32.9% | $259,789 +60.2% |
| 2015 | $4,551 +11.9% | $162,135 +10% |
| 2014 | $4,069 +28.5% | $147,396 +10% |
| 2013 | $3,167 | $133,997 +10% |
| 2012 | $3,167 -22.3% | $121,816 -27.7% |
| 2011 | $4,074 -19.7% | $168,478 -30.8% |
| 2010 | $5,072 -9.4% | $243,291 -15.5% |
| 2009 | $5,601 -26.5% | $287,919 -20.3% |
| 2007 | $7,619 +4113.5% | $361,232 |
| 2001 | $181 | -- |
Find assessor info on the county website
Monthly payment
Est. payment
Payment breakdown
Explore the cost of this home by adjusting the details. Changes won't be saved.Climate risks
Neighborhood: West Perrine
Similar homes
- $1,125,0008 bd4 ba2.6k sqftGreene Sub 2nd Addn, Miami, FL 33157For Sale
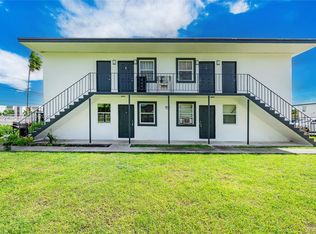
 MLS ID #A12125402, Aliette Perez, Charleemax Realtors. MIAMI
- $900,0006 bd3 ba2.5k sqftS Miami Heights Addn C, Miami, FL 33157For Sale
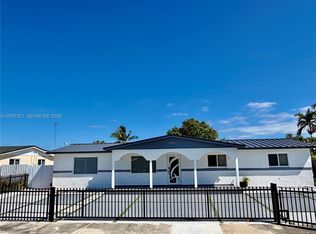 MLS ID #A12001321, Adonis Montalvo, United Realty Group Inc. MIAMI
- $719,9006 bd4 ba2.6k sqftGreen Hills Sec 3, Miami, FL 33157For Sale
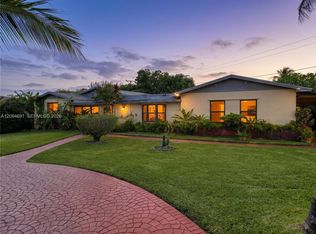 MLS ID #A12084691, Cinthia Rai, The Keyes Company. MIAMI
- $740,0005 bd3 ba2k sqftBel Aire Sec 5, Cutler Bay, FL 33157For Sale
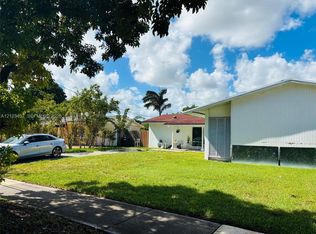 MLS ID #A12123453, Valentina Londono, Modern International Real Estate INC. MIAMI
- $910,0005 bd4 ba3k sqftCutler Cay, Cutler Bay, FL 33157For SaleMLS ID #A12079440, Christiane Goncalves Diaz, Florida Select Realty. MIAMI
- $1,000,0005 bd3 ba2.8k sqftBonita Grand Estates South, Miami, FL 33177For SaleMLS ID #A12123899, Monika Tefel, Coldwell Banker Realty. MIAMI
- $794,9955 bd5 ba2.2k sqftFairway Lake South Sec 2, Miami, FL 33157For SaleMLS ID #A12116353, David Garcia, Tremendo Real Estate, LLC.. MIAMI
- $1,200,0008 bd4 ba2.6k sqftGreene Sub 2nd Addn, Miami, FL 33157For SaleMLS ID #A12099402, Anthony Mocegui, Lifestyle International Realty. MIAMI
- $720,0005 bd4 ba2.3k sqftGreen Hills Sec 2, Miami, FL 33157For SaleMLS ID #A12097120, Carolina Larco, La Rosa Realty Kendall, LLC.. MIAMI
- $1,200,0008 bd5 ba3.2k sqftMap Of Perrine, Miami, FL 33157New ConstructionMLS ID #A12052379, Karla Hycert, My Realty Group, LLC.. MIAMI
- $699,9995 bd3 ba2.4k sqftSo Miami Heights Addn V, Miami, FL 33157For SaleMLS ID #A12119261, Vladimir Guia Robaina, Realty One Group Evolution. MIAMI
- $910,0005 bd5 ba2.5k sqftLimewood Grove, Miami, FL 33177For SaleMLS ID #A12111085, Roberto Echavarria, London Foster Realty. MIAMI
- $995,0005 bd3 ba2.3k sqftBel Aire Sec 16, Palmetto Bay, FL 33157For SaleMLS ID #A12107938, Pierina Cancino, The Lab Realty Group, LLC. MIAMI
- $749,9995 bd3 ba2.5k sqftFairway Park Sec 1, Miami, FL 33157For SaleMLS ID #A12089068, Daniel Gonzalez, Lifestyle International Realty. MIAMI
- $879,0005 bd4 ba2.5k sqftCountryside, Miami, FL 33177For SaleMLS ID #A12079597, Jeannette Pupo, Intelliagents Realty, LLC. MIAMI
- $1,045,0005 bd5 ba3.1k sqftCutler Cay, Cutler Bay, FL 33157For SaleMLS ID #A12117807, Daniela Guerrieri, Luxe Properties. MIAMI
- $760,0005 bd3 ba2.4k sqftBel Aire Sec 4, Cutler Bay, FL 33157For SaleMLS ID #A12104524, Felix Santos, Compass Florida, LLC. MIAMI
- $905,0008 bd4 ba3.1k sqftRichards Sub, Miami, FL 33170New ConstructionMLS ID #A12087000, Henrry Palacio Lamoth, Florida Capital Realty. MIAMI
- $690,0005 bd4 ba2.7k sqftSable Palm Estates, Miami, FL 33177For SaleMLS ID #A12119625, Krissy Camacho PA, Coldwell Banker Realty. MIAMI
- $730,0006 bd4 ba2.8k sqftWhispering Pines Estates, Cutler Bay, FL 33157For SaleMLS ID #A12089723, Carlos Orozco, Real Estate Connection of South Florida. MIAMI
