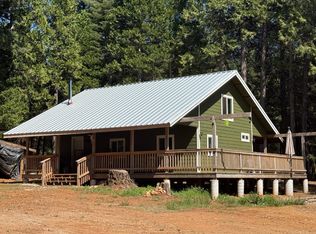
guest house included
Pre-foreclosure
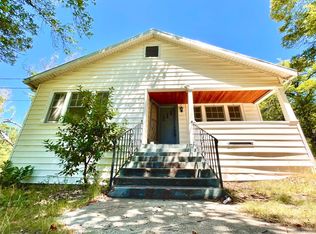
Street View
Est. $479,200
10745 Red Dog Rd, Nevada City, CA 95959
2beds
828sqft
SingleFamily
Built in 1940
3.04 Acres Lot
$479,200 Zestimate®
$579/sqft
$-- HOA
Overview
- 43 days |
- 9 |
- 0 |
Facts & features
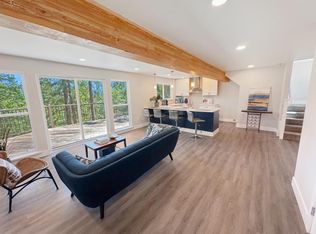
Interior
Bedrooms & bathrooms
- Bedrooms: 2
- Bathrooms: 1
- Full bathrooms: 1
Heating
- Other, Electric, Gas
Cooling
- Central
Features
- Basement: Basement (not specified)
- Has fireplace: No
Interior area
- Total interior livable area: 828 sqft
Property
Parking
- Parking features: Garage - Detached
Features
- Has view: Yes
- View description: Territorial
Lot
- Size: 3.04 Acres
Details
- Parcel number: 036370024000
Construction
Type & style
- Home type: SingleFamily
Materials
- Roof: Asphalt
Condition
- Year built: 1940
Community & HOA
Location
- Region: Nevada City
Financial & listing details
- Price per square foot: $579/sqft
- Tax assessed value: $387,896
- Annual tax amount: $4,253
Visit our professional directory to find a foreclosure specialist in your area that can help with your home search.
Find a foreclosure agentForeclosure details
Estimated market value
$479,200
$417,000 - $541,000
$2,248/mo
Price history
| Date | Event | Price |
|---|---|---|
| 9/1/2000 | Sold | $225,000+66.7%$272/sqft |
Source: Public Record Report a problem | ||
| 11/7/1997 | Sold | $135,000$163/sqft |
Source: Public Record Report a problem | ||
Public tax history
| Year | Property taxes | Tax assessment |
|---|---|---|
| 2025 | $4,253 +2.3% | $387,896 +2% |
| 2024 | $4,159 +2.1% | $380,291 +2% |
| 2023 | $4,075 +3.3% | $372,835 +2% |
| 2022 | $3,945 +1.7% | $365,526 +2% |
| 2021 | $3,881 -0.3% | $358,359 +1% |
| 2020 | $3,893 +2% | $354,685 +2% |
| 2019 | $3,818 +2% | $347,731 +2% |
| 2018 | $3,742 +2% | $340,914 +2% |
| 2017 | $3,669 +3.8% | $334,232 +2% |
| 2016 | $3,536 +1.5% | $327,680 +1.5% |
| 2015 | $3,484 +1.6% | $322,761 +2% |
| 2014 | $3,429 | $316,441 +0.5% |
| 2013 | -- | $315,013 +2% |
| 2012 | -- | $308,838 +2% |
| 2011 | -- | $302,784 +0.8% |
| 2010 | -- | $300,524 -0.2% |
| 2009 | -- | $301,240 +2% |
| 2008 | -- | $295,336 +2% |
| 2007 | -- | $289,547 +2% |
| 2006 | -- | $283,871 +2% |
| 2005 | -- | $278,306 +2% |
| 2004 | -- | $272,852 +1.9% |
| 2003 | -- | $267,852 +7.7% |
| 2002 | $248 | $248,600 +8.6% |
| 2001 | $248 | $229,000 |
Find assessor info on the county website
Monthly payment
Estimated monthly payment$1,822
All calculations are estimates and provided by Zillow, Inc. for informational purposes only. Actual amounts may vary.
HOA fees may include property taxes on listings classified as Co-Ops. Contact the listing agent and/or owner for fee details.
Mortgage interest rates are dependent on a number of factors, including credit score, down payment, and repayment length. Interest rate data provided by Zillow Group Marketplace, Inc. as of 1/1/1970 from various mortgage lenders with which we have lead or other similar arrangements; the Estimated Payment is an average of those rates.
See how much you could borrow to make a competitive offer.
Climate risks
Neighborhood: 95959
Nearby schools
GreatSchools rating
- 7/10Seven Hills Intermediate SchoolGrades: 4-8Distance: 1.5 mi
- 7/10Nevada Union High SchoolGrades: 9-12Distance: 3 mi
- 6/10Deer Creek Elementary SchoolGrades: K-3Distance: 1.5 mi


- California
- Nevada County
- Nevada City
- 95959
- 10745 Red Dog Rd
Nearby cities
Nearby zip codes
Other Nevada City Topics
