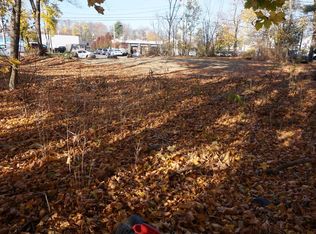
Attention builders and home buyers looking to build a new home in a great East side location near the Sudbury State Forest. Beautiful lot with lots of potential for a new home. Fire damaged estate sale. Town water, sewer available on the street. Property sold AS IS. Do not walk inside the remains of the house. Buyers and their agents to do their own due diligence regarding sewer tie in and building specifications. License to sell needed in probate court. Time line for license begins at p&s signing.
Lot/land
$299,900
11 Hanlon Dr, Marlborough, MA 01752
--beds
0baths
1Acres
Residential
Built in ----
1 Acres Lot
$295,300 Zestimate®
$--/sqft
$-- HOA
What's special
Beautiful lot
- 2 days
- 249
- 7
Zillow last checked:
Listing updated:
Listed by:
Christine Natale 978-621-9009,
Christine E. Natale, Broker 978-937-1800
Source: MLS PIN,MLS#: 73594308
Facts & features
Interior
Bedrooms & bathrooms
- Bathrooms: 0
Features
- Has basement: No
Property
Lot
- Size: 1 Acres
- Features: Wooded
Details
- Parcel number: 608996
- Zoning: RR
Utilities & green energy
- Electric: On-Site
- Gas: Other (See Remarks)
- Sewer: Other
- Water: Public
Community & HOA
Community
- Features: Park, Walk/Jog Trails, Highway Access
HOA
- Has HOA: No
Location
- Region: Marlborough
Financial & listing details
- Tax assessed value: $683,800
- Annual tax amount: $7,197
- Date on market: 10/22/2026
- Electric utility on property: Yes
Estimated market value
$295,300
$281,000 - $310,000
$3,533/mo
Price history
| Date | Event | Price |
|---|---|---|
| 10/22/2026 | Listed for sale | $299,900 |
Source: MLS PIN #73594304 Report a problem | ||
Public tax history
| Year | Property taxes | Tax assessment |
|---|---|---|
| 2025 | $6,312 +2.5% | $640,200 +6.5% |
| 2024 | $6,157 -4.5% | $601,300 +7.6% |
| 2023 | $6,447 +2.7% | $558,700 +16.8% |
| 2022 | $6,278 +3.2% | $478,500 +8.5% |
| 2021 | $6,086 +3.2% | $441,000 +6.1% |
| 2020 | $5,895 +2.5% | $415,700 +1.7% |
| 2019 | $5,753 -4% | $408,900 -0.1% |
| 2018 | $5,991 +2.9% | $409,500 +7.8% |
| 2017 | $5,820 +2% | $379,900 +2.1% |
| 2016 | $5,706 +8.8% | $372,000 +11.8% |
| 2015 | $5,245 +2.7% | $332,800 +5% |
| 2014 | $5,107 +2.3% | $317,000 -4.7% |
| 2013 | $4,992 +2.9% | $332,800 +1.5% |
| 2012 | $4,851 +3.2% | $327,800 -2.8% |
| 2011 | $4,702 +2.9% | $337,300 -1% |
| 2010 | $4,570 -7.2% | $340,800 -11.7% |
| 2009 | $4,924 -5.7% | $385,900 -6% |
| 2008 | $5,220 -3.6% | $410,400 -4.1% |
| 2007 | $5,415 +5.9% | $428,100 +2.8% |
| 2006 | $5,115 +1.3% | $416,500 +13.7% |
| 2005 | $5,049 +16.4% | $366,400 +9% |
| 2004 | $4,336 +2.1% | $336,100 +3.8% |
| 2003 | $4,246 +12.5% | $323,900 +27.9% |
| 2001 | $3,774 +5.3% | $253,300 +15.3% |
| 2000 | $3,583 +6.6% | $219,700 +10.7% |
| 1998 | $3,361 | $198,500 |
Find assessor info on the county website
Monthly payment
Climate risks
Neighborhood: Carlsbrooke
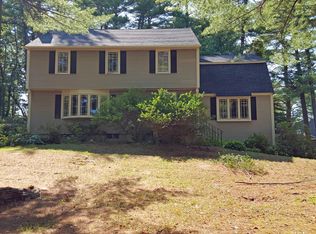
Similar homes
- $300,0001.44 acres0 Pleasant St, Marlborough, MA 01752Lot/Land
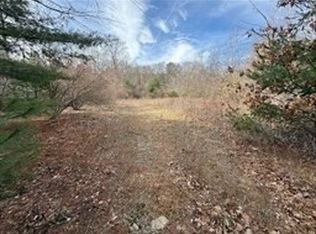 MLS ID #73535025, Christi Smith, eXp Realty LLC. MLS PIN
- $300,00011.27 acres0 Winter St, Holliston, MA 01746Lot/Land
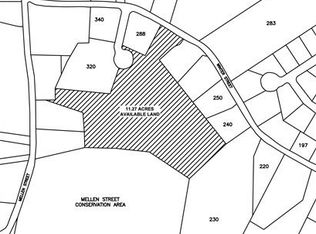 MLS ID #73593884, Nicole Esposito, Keller Williams Boston MetroWest. MLS PIN
- $285,0000.77 acres0 N Shore Dr, Stow, MA 01775Lot/Land
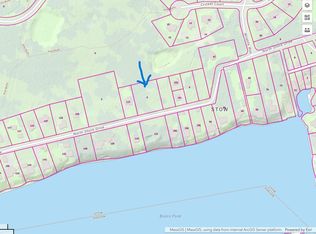 MLS ID #73563459, Sirota Hudgins Team, Gibson Sotheby's International Realty. MLS PIN
- $285,0000.51 acres68 River St, Marlborough, MA 01752Lot/Land
 MLS ID #73514982, Douglas Stamm, StartPoint Realty. MLS PIN
