It sits in the heart of Hornsby, TN. Hornsby K-8 school is directly across the street. This home will require some updates but provides a beautiful lot with multiple outbuildings. Two 17x13 detached carports, a 13x38 shed, a 10x14 wooden deck, and a small basement, a large backyard and additional lot to the left of the home.
For sale
$129,900
110 Church St, Hornsby, TN 38044
3beds
1,778sqft
Single Family Residence
Built in 1960
1 Acres Lot
$-- Zestimate®
$73/sqft
$-- HOA
What's special
Small basementLarge backyardMultiple outbuildingsBeautiful lot
- 44 days
- 133
- 5
Zillow last checked:
Listing updated:
Listed by:
Jacey Ross,
Action Realty 731-645-7101
Source: MAAR,MLS#: 10230065
Facts & features
Interior
Bedrooms & bathrooms
- Bedrooms: 3
- Bathrooms: 1
- Full bathrooms: 1
Primary bedroom
- Area: 132
- Dimensions: 11 x 12
Dining room
- Area: 120
- Dimensions: 12 x 10
Living room
- Features: Separate Den, Separate Living Room
- Area: 252
- Dimensions: 18 x 14
Den
- Area: 144
- Dimensions: 12 x 12
Heating
- Wall Furnace
Cooling
- Window Unit(s)
Features
- 2 Full Primary Baths, All Bedrooms Down, Square Feet Source: AutoFill (MAARdata) or Public Records (Cnty Assessor Site)
- Flooring: Hardwood
- Number of fireplaces: 2
Interior area
- Total interior livable area: 1,778 sqft
Property
Parking
- Total spaces: 2
- Parking features: Driveway/Pad
- Covered spaces: 2
- Has uncovered spaces: Yes
Features
- Stories: 1
- Patio & porch: Porch
- Pool features: None
Lot
- Size: 1 Acres
- Dimensions: 1
- Features: Some Trees
Details
- Parcel number: 093KA01200000
Construction
Type & style
- Home type: SingleFamily
- Architectural style: Traditional
- Property subtype: Single Family Residence
Materials
- Wood/Composition
Condition
- New construction: No
- Year built: 1960
Community & HOA
Location
- Region: Hornsby
Financial & listing details
- Price per square foot: $73/sqft
- Tax assessed value: $119,900
- Annual tax amount: $641
- Price range: $129.9K - $129.9K
- Date on market: 9/9/2026
Estimated market value
Not available
Estimated sales range
Not available
$1,146/mo
Price history
| Date | Event | Price |
|---|---|---|
| 9/9/2026 | Listed for sale | $129,900+136.2%$73/sqft |
Source:  MAAR #10230065 Report a problem | ||
| 2/25/2025 | Sold | $55,000-19.7%$31/sqft |
Source: MAAR #10151254 Report a problem | ||
| 7/24/2024 | Pending sale | $68,500$39/sqft |
Source: MAAR #10151254 Report a problem | ||
| 6/18/2024 | Price change | $68,500-23%$39/sqft |
Source: MAAR #10151254 Report a problem | ||
| 4/25/2024 | Listed for sale | $89,000-5.3%$50/sqft |
Source: MAAR #10151254 Report a problem | ||
| 6/30/2023 | Listed for sale | $94,000$53/sqft |
Source: MAAR #10151254 Report a problem | ||
Public tax history
| Year | Property taxes | Tax assessment |
|---|---|---|
| 2025 | $641 +0% | $29,975 |
| 2024 | $641 0% | $29,975 |
| 2023 | $641 +63.8% | $29,975 +131.9% |
| 2022 | $391 | $12,925 |
| 2021 | $391 | $12,925 |
| 2020 | $391 | $12,925 |
| 2019 | $391 | $12,925 |
| 2018 | $391 +9% | $12,925 +6.6% |
| 2017 | $359 -20% | $12,125 |
| 2016 | $449 +31.6% | $12,125 |
| 2015 | $341 | $12,125 |
| 2014 | $341 | $12,125 |
| 2013 | -- | $12,125 |
| 2012 | $327 | $12,125 +2.4% |
| 2011 | $327 +9.5% | $11,840 |
| 2010 | $298 | $11,840 |
| 2009 | $298 | $11,840 |
| 2008 | $298 | $11,840 |
| 2007 | $298 -14.3% | $11,840 |
| 2006 | $348 +1.2% | $11,840 +1.2% |
| 2005 | $344 +5% | $11,698 |
| 2004 | $328 +12.2% | $11,698 +12.2% |
| 2002 | $292 | $10,425 |
| 2001 | -- | $10,425 -75% |
| 2000 | -- | $41,700 |
Find assessor info on the county website
Monthly payment
Est. payment
Payment breakdown
Explore the cost of this home by adjusting the details. Changes won't be saved.Climate risks
Neighborhood: 38044
Similar homes
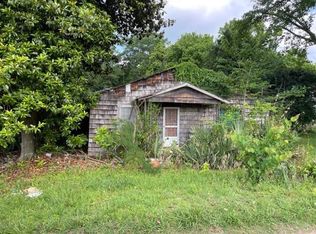
- $149,9003 bd1 ba1.4k sqft2260 Hebron Rd, Middleton, TN 38052For Sale
 MLS ID #10232246, Brian Smith, Crye-Leike, Inc., REALTORS. MAAR
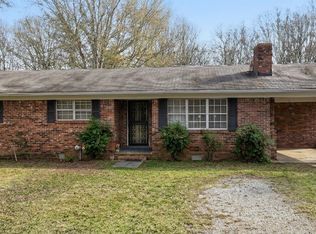
- $157,5003 bd1 ba1.4k sqft1160 Breeden Ln, Bolivar, TN 38008For Sale
 MLS ID #10231571, Karen Lanier, Lanier Realty. MAAR
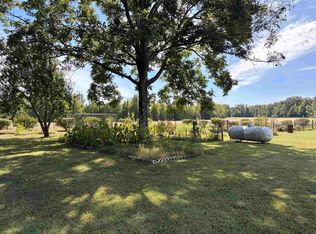
- $185,9003 bd2 ba1.5k sqft9963 Highway 64 W, Hornsby, TN 38044For Sale
 MLS ID #10229771, Adam Wright, Duane Wright Realty. MAAR
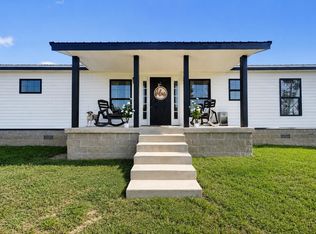
- $130,0003 bd2 ba1.2k sqft2870 Walnut Grove Rd, Bolivar, TN 38008For Sale
 MLS ID #2603761, Brandi Isom, RE/MAX Realty Source. CWTAR
- $149,9003 bd2 ba1.1k sqft120 Clifft Rd, Bolivar, TN 38008For Sale
 MLS ID #3613236, Lashae Whitley. RealTracs MLS as distributed by MLS GRID
