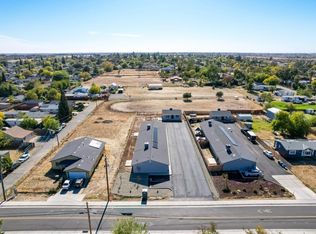
This 4704 square foot multi family home has 10 bedrooms and 6.0 bathrooms. This home is located at 1104 F St, Marysville, CA 95901.
Pre-foreclosure
Street View
Est. $782,700
1104 F St, Marysville, CA 95901
10beds
6baths
4,704sqft
MultiFamily
Built in 1977
-- sqft lot
$782,700 Zestimate®
$166/sqft
$-- HOA
Overview
- 19 days
- 4
- 0
Facts & features
Interior
Bedrooms & bathrooms
- Bedrooms: 10
- Bathrooms: 6
Heating
- Other
Cooling
- Central
Interior area
- Total interior livable area: 4,704 sqft
Property
Lot
- Size: 9,373 Square Feet
Details
- Parcel number: 009211007000
Construction
Type & style
- Home type: MultiFamily
Condition
- Year built: 1977
Community & HOA
Location
- Region: Marysville
Financial & listing details
- Price per square foot: $166/sqft
- Tax assessed value: $764,069
Foreclosure details
Estimated market value
$782,700
$712,000 - $853,000
$1,527/mo
Price history
| Date | Event | Price |
|---|---|---|
| 2/24/2026 | Listing removed | $1,219,000$259/sqft |
Source: MetroList Services of CA #225088986 Report a problem | ||
| 9/10/2025 | Price change | $1,219,000+6.1%$259/sqft |
Source: MetroList Services of CA #225088986 Report a problem | ||
| 7/5/2025 | Listed for sale | $1,149,000+59.6%$244/sqft |
Source: MetroList Services of CA #225088986 Report a problem | ||
| 9/30/2022 | Sold | $720,000+17.1%$153/sqft |
Source: Public Record Report a problem | ||
| 5/27/2022 | Sold | $615,000+11.8%$131/sqft |
Source: Public Record Report a problem | ||
| 3/1/2019 | Sold | $550,000+44.7%$117/sqft |
Source: Public Record Report a problem | ||
| 7/1/2016 | Sold | $380,000$81/sqft |
Source: MetroList Services of CA #201600048 Report a problem | ||
Public tax history
| Year | Property taxes | Tax assessment |
|---|---|---|
| 2026 | -- | $764,069 +2% |
| 2025 | $8,445 +1.7% | $749,088 +2% |
| 2024 | $8,301 +1.6% | $734,400 +2% |
| 2023 | $8,167 +23.2% | $720,000 +24.5% |
| 2022 | $6,627 +1% | $578,146 +2% |
| 2021 | $6,558 +0.8% | $566,811 +1% |
| 2020 | $6,504 +40.8% | $561,000 +41.9% |
| 2019 | $4,618 +1.8% | $395,352 +2% |
| 2018 | $4,538 +3.1% | $387,600 +2% |
| 2017 | $4,403 +77.5% | $380,000 +83.4% |
| 2016 | $2,480 -52.9% | $207,143 +1.5% |
| 2015 | $5,269 +0% | $204,032 +2% |
| 2014 | $5,268 | $200,036 +0.5% |
| 2013 | -- | $199,133 +2% |
| 2012 | -- | $195,229 +2% |
| 2011 | -- | $191,402 +0.8% |
| 2010 | -- | $189,973 -0.2% |
| 2009 | -- | $190,425 +2% |
| 2008 | -- | $186,692 +2% |
| 2007 | -- | $183,032 +2% |
| 2006 | -- | $179,444 +2% |
| 2005 | -- | $175,927 +2% |
| 2004 | -- | $172,479 +1.9% |
| 2003 | -- | $169,319 +2% |
| 2002 | -- | $166,000 +2% |
| 2001 | -- | $162,746 |
Find assessor info on the county website
Monthly payment
Climate risks
Neighborhood: 95901
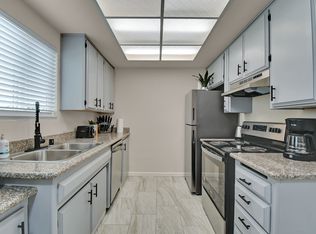
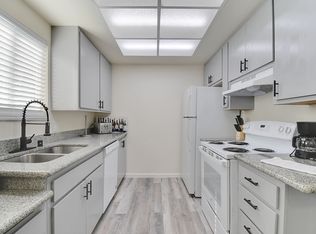
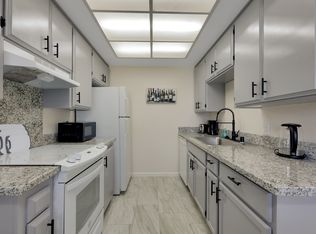

Similar homes
- $575,0008 bd4 ba3.5k sqft1315 E St, Marysville, CA 95901For Sale
 MLS ID #226073616, Brian Sandgren. MetroList Services of CA
- $524,90010 bd-- ba3.8k sqft291 2nd St, Yuba City, CA 95991For Sale
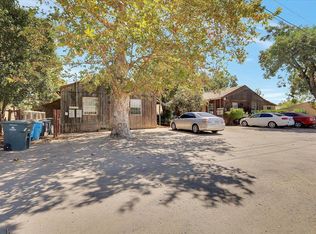 MLS ID #226103987, David Brown. MetroList Services of CA
- $900,0008 bd4 ba3.5k sqft1570 Alfred Way, Yuba City, CA 95993For Sale
 MLS ID #226057208, Eric Liu. MetroList Services of CA
- $849,9008 bd5 ba3.4k sqft1852 11th Ave, Olivehurst, CA 95961For Sale
 MLS ID #226131184, Alexander Shive. MetroList Services of CA
