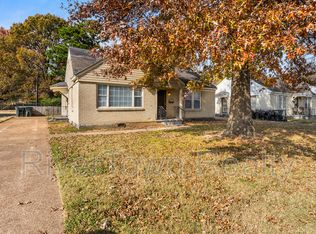
Perfect for Investor...4 beds/2bath..could be single residence and/or duplex
For sale
$95,000
1105 N Watkins St, Memphis, TN 38107
4beds
1,786sqft
Single Family Residence
Built in 1948
10,018 Square Feet Lot
$-- Zestimate®
$53/sqft
$-- HOA
What's special
- 12 days
- 169
- 9
Likely to sell faster than
Zillow last checked:
Listing updated:
Listed by:
Mae R Moore,
Crye-Leike, Inc., REALTORS 901-756-8100
Source: MAAR,MLS#: 10232010
Facts & features
Interior
Bedrooms & bathrooms
- Bedrooms: 4
- Bathrooms: 2
- Full bathrooms: 2
Primary bedroom
- Dimensions: 0 x 0
Dining room
- Dimensions: 0 x 0
Living room
- Features: LR/DR Combination
- Dimensions: 0 x 0
Den
- Dimensions: 0 x 0
Heating
- Other (See REMARKS)
Cooling
- Other (See REMARKS)
Features
- Full Bath Down, Square Feet Source: AutoFill (MAARdata) or Public Records (Cnty Assessor Site)
- Flooring: Wood Laminate Floors
- Has fireplace: No
Interior area
- Total interior livable area: 1,786 sqft
Property
Parking
- Parking features: Driveway/Pad
- Has uncovered spaces: Yes
Features
- Stories: 1
- Exterior features: Other (See REMARKS)
- Pool features: None
Lot
- Size: 10,018 Square Feet
- Dimensions: 60 x 159
- Features: Some Trees
Details
- Parcel number: 040030 00014
Construction
Type & style
- Home type: SingleFamily
- Architectural style: Traditional
- Property subtype: Single Family Residence
Condition
- New construction: No
- Year built: 1948
Community & HOA
Community
- Subdivision: Colonial Village
Location
- Region: Memphis
Financial & listing details
- Price per square foot: $53/sqft
- Tax assessed value: $97,600
- Annual tax amount: $1,286
- Price range: $95K - $95K
- Date on market: 10/8/2026
Estimated market value
Not available
Estimated sales range
Not available
$1,568/mo
Price history
| Date | Event | Price |
|---|---|---|
| 10/8/2026 | Listed for sale | $95,000-26.9%$53/sqft |
Source:  MAAR #10232010 Report a problem | ||
| 4/17/2026 | Listing removed | $130,000$73/sqft |
Source: MAAR #10195257 Report a problem | ||
| 10/16/2025 | Listed for sale | $130,000$73/sqft |
Source: MAAR #10195257 Report a problem | ||
| 8/21/2025 | Pending sale | $130,000$73/sqft |
Source: MAAR #10195257 Report a problem | ||
| 7/8/2025 | Listed for sale | $130,000$73/sqft |
Source: MAAR #10195257 Report a problem | ||
| 6/11/2025 | Pending sale | $130,000$73/sqft |
Source: MAAR #10195257 Report a problem | ||
| 4/28/2025 | Listed for sale | $130,000+2066.7%$73/sqft |
Source: MAAR #10195257 Report a problem | ||
| 5/21/2009 | Sold | $6,000-77%$3/sqft |
Source: Public Record Report a problem | ||
| 5/23/2008 | Sold | $26,089-45.6%$15/sqft |
Source: Public Record Report a problem | ||
| 11/21/1996 | Sold | $48,000$27/sqft |
Source: Public Record Report a problem | ||
Public tax history
| Year | Property taxes | Tax assessment |
|---|---|---|
| 2025 | $1,286 +35.1% | $24,400 +68.9% |
| 2024 | $952 +8.1% | $14,450 |
| 2023 | $880 | $14,450 |
| 2022 | -- | $14,450 |
| 2021 | -- | $14,450 +19.7% |
| 2020 | $386 | $12,075 |
| 2019 | $386 -21.1% | $12,075 |
| 2018 | $489 -45.1% | $12,075 |
| 2017 | $891 +117.1% | $12,075 |
| 2016 | $411 -11.8% | $12,075 |
| 2014 | $466 | $12,075 |
| 2013 | -- | $12,075 -17.3% |
| 2012 | -- | $14,600 |
| 2011 | -- | $14,600 |
| 2010 | -- | $14,600 |
| 2009 | -- | $14,600 +15.9% |
| 2008 | -- | $12,600 |
| 2007 | -- | $12,600 |
| 2006 | -- | $12,600 |
| 2005 | -- | $12,600 -1% |
| 2004 | -- | $12,725 |
| 2003 | -- | $12,725 |
| 2002 | -- | $12,725 -37.5% |
| 2001 | -- | $20,360 +14.6% |
| 2000 | -- | $17,760 |
Find assessor info on the county website
Monthly payment
Est. payment
Payment breakdown
Explore the cost of this home by adjusting the details. Changes won't be saved.Climate risks
Neighborhood: Midtown


Similar homes
- $94,9004 bd2 ba1k sqft1319 Nicholas St, Memphis, TN 38107For Sale
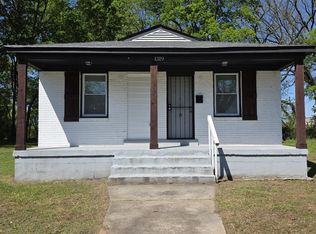 MLS ID #10220347, Dean Harris, CrestCore Realty MphsBrokerage. MAAR
- $100,0002 bd1 ba1k sqft1305 Bryan St, Memphis, TN 38108For Sale
 MLS ID #10232662, Scott Housewirth, Crye-Leike Inc., REALTORS. MAAR
- $115,0004 bd2 ba2.1k sqft1277 Snowden Ave, Memphis, TN 38107For Sale
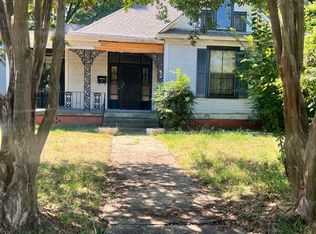 MLS ID #10229726, Alissa Fowler, CrestCore Realty MphsBrokerage. MAAR
- $104,9004 bd1 ba1k sqft838 Crockett St, Memphis, TN 38107For Sale
 MLS ID #10216480, Dean Harris, CrestCore Realty MphsBrokerage. MAAR
- $84,9005 bd2 ba2.1k sqft530 Marianna St, Memphis, TN 38111For Sale
 MLS ID #3312141, Christopher Mosby. RealTracs MLS as distributed by MLS GRID
