Dramatic price reduction for this lovely home with all the comforts . . . Nice size living room with eat-in area open to galley kitchen with pass through. Cathedral ceilings throughout make this look much larger than actual square footage. Seller has add tasteful color to most of the home along with light color wood laminate flooring. Kitchen has tile floors & counter tops. Baths have tile vanity tops. Rear yard is fenced, front yard landscaped with mature trees & one old mulberry that is awesome! Three car garage is quite a bonus and includes the laundry area. Central heat and a/c plus evap cooling. New homes all along Mescalero.
Pre-foreclosure
Street View
Est. $356,600
11064 Mescalero Ave, Morongo Valley, CA 92256
3beds
2baths
1,196sqft
SingleFamily
Built in 1988
8,624 Square Feet Lot
$356,600 Zestimate®
$298/sqft
$-- HOA
Overview
- 62 days
- 4
- 0
Facts & features
Interior
Bedrooms & bathrooms
- Bedrooms: 3
- Bathrooms: 2
Heating
- Other
Cooling
- Central
Interior area
- Total interior livable area: 1,196 sqft
Property
Parking
- Total spaces: 3
- Parking features: Garage - Attached
Features
- Has view: Yes
- View description: Territorial
Lot
- Size: 8,624 Square Feet
Details
- Parcel number: 0583162230000
Construction
Type & style
- Home type: SingleFamily
Materials
- wood frame
- Roof: Shake / Shingle
Condition
- Year built: 1988
Community & HOA
Location
- Region: Morongo Valley
Financial & listing details
- Price per square foot: $298/sqft
- Tax assessed value: $343,000
Foreclosure details
Estimated market value
$356,600
$339,000 - $374,000
$2,250/mo
Price history
| Date | Event | Price |
|---|---|---|
| 5/6/2026 | Listing removed | $335,000-9.5%$280/sqft |
Source:  bridgeMLS/CCAR/Bay East AOR #CRJT23047980 Report a problem | ||
| 1/7/2026 | Listing removed | $369,999$309/sqft |
Source: eXp Realty #219114817DA Report a problem | ||
| 12/23/2025 | Listed for sale | $369,999$309/sqft |
Source: eXp Realty #219114817DA Report a problem | ||
| 10/16/2024 | Listing removed | $369,999$309/sqft |
Source:  Greater Palm Springs Realtors #219114817 Report a problem | ||
| 9/26/2024 | Price change | $369,999-1.3%$309/sqft |
Source:  CDAR/ Desert Area MLS #219114817 Report a problem | ||
| 8/24/2024 | Price change | $375,000-1.3%$314/sqft |
Source: CDAR/ Desert Area MLS #219114817 Report a problem | ||
| 8/1/2024 | Listed for sale | $380,000$318/sqft |
Source: CDAR/ Desert Area MLS #219114817 Report a problem | ||
| 8/1/2024 | Listing removed | -- |
Source: Greater Palm Springs Realtors #219114201 Report a problem | ||
| 7/16/2024 | Listed for sale | $380,000+10.1%$318/sqft |
Source: Greater Palm Springs Realtors #219114201 Report a problem | ||
| 6/7/2023 | Sold | $345,000+3%$288/sqft |
Source: Public Record Report a problem | ||
| 5/22/2023 | Pending sale | $335,000$280/sqft |
Source:  CRMLS #JT23047980 Report a problem | ||
| 3/26/2023 | Listed for sale | $335,000+235%$280/sqft |
Source: CRMLS #JT23047980 Report a problem | ||
| 10/31/2008 | Sold | $100,000+72.4%$84/sqft |
Source: Public Record Report a problem | ||
| 7/10/1998 | Sold | $58,000$48/sqft |
Source: Public Record Report a problem | ||
Public tax history
| Year | Property taxes | Tax assessment |
|---|---|---|
| 2026 | -- | $343,000 +1.5% |
| 2025 | $3,886 -2.6% | $337,900 -4% |
| 2024 | $3,990 +151.6% | $351,900 +184.3% |
| 2023 | $1,586 +2.1% | $123,776 +2% |
| 2022 | $1,554 +1.2% | $121,349 +2% |
| 2021 | $1,536 +0.9% | $118,970 +1% |
| 2020 | $1,522 +1.7% | $117,750 +2% |
| 2019 | $1,496 +2.4% | $115,441 +2% |
| 2018 | $1,461 +1.1% | $113,178 +2% |
| 2017 | $1,445 | $110,959 +2% |
| 2016 | $1,445 +1.7% | $108,783 +1.5% |
| 2015 | $1,421 +2.3% | $107,149 +2% |
| 2014 | $1,389 | $105,050 +28.1% |
| 2013 | -- | $82,000 +6.5% |
| 2012 | -- | $77,000 |
| 2011 | -- | $77,000 |
| 2010 | -- | $77,000 -23% |
| 2009 | -- | $100,000 +44.5% |
| 2008 | -- | $69,224 +2% |
| 2007 | -- | $67,867 +2% |
| 2006 | -- | $66,536 +2% |
| 2005 | -- | $65,231 +2% |
| 2004 | -- | $63,952 +1.9% |
| 2003 | -- | $62,780 +2% |
| 2002 | -- | $61,549 +2% |
| 2001 | -- | $60,343 +2% |
| 2000 | -- | $59,160 |
Find assessor info on the county website
Monthly payment
Climate risks
Neighborhood: 92256
- $15,3902.28 acresMescalero Ave, Morongo valley, CA 92256Off Market
- $315,3003 bd2 ba1.1k sqft11076 Mescalero Ave, Morongo Valley, CA 92256Off Market
- $446,9003 bd2 ba2.4k sqft49374 Mojave Dr, Morongo Valley, CA 92256Off Market
- $350,0003 bd1 ba1.3k sqft11069 Mescalero Ave, Morongo Valley, CA 92256Off Market
Similar homes
- $364,5004 bd2 ba1.7k sqft9711 Brookline Ave, Desert Hot Springs, CA 92240For Sale
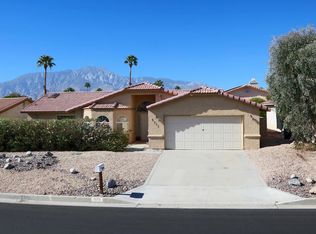 MLS ID #219153809DA, Patricia O'Neal, Equity Union. CRMLS
- $339,0004 bd2 ba1.5k sqft12101 United Rd, Desert Hot Springs, CA 92240For Sale
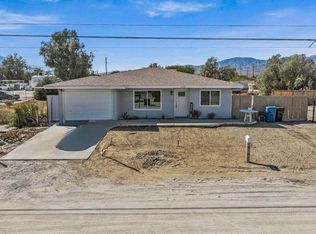 MLS ID #219153966DA, Ryan Santos, Real Brokerage Technologies. CRMLS
- $359,9003 bd2 ba1.6k sqft64574 Brae Burn Ave, Desert Hot Springs, CA 92240For Sale
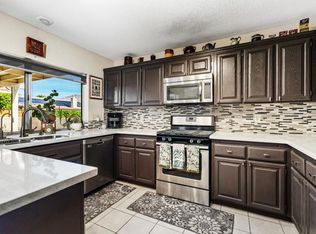 MLS ID #219148893DA, Gregory Leonard, Coldwell Banker Realty. CRMLS
- $375,0003 bd2 ba1.4k sqft8400 Annandale Ave, Desert Hot Springs, CA 92240For Sale
 MLS ID #219148402DA, Felipe Hernandez, Equity Union. CRMLS
