For sale by owner.
For sale by owner
$80,000
1110 Maria Dr, Jackson, MS 39204
3beds
1,537sqft
SingleFamily
Built in 1961
1 Acres Lot
$-- Zestimate®
$52/sqft
$-- HOA
Overview
- 9 days
- 288
- 21
Listed by:
Property Owner (601) 317-9970
Facts & features
Interior
Bedrooms & bathrooms
- Bedrooms: 3
- Bathrooms: 2
- Full bathrooms: 2
Heating
- Baseboard, Forced air, Stove, Electric, Gas
Cooling
- Central
Appliances
- Included: Dishwasher, Freezer, Range / Oven, Refrigerator
Features
- Flooring: Tile, Linoleum / Vinyl
- Basement: None
- Has fireplace: Yes
Interior area
- Total interior livable area: 1,537 sqft
Property
Parking
- Total spaces: 5
- Parking features: Carport
Features
- Exterior features: Other, Vinyl, Brick
Lot
- Size: 1 Acres
Details
- Parcel number: 633242
Construction
Type & style
- Home type: SingleFamily
Materials
- Roof: Other
Condition
- New construction: No
- Year built: 1961
Community & HOA
Community
- Features: Fitness Center
Location
- Region: Jackson
Financial & listing details
- Price per square foot: $52/sqft
- Tax assessed value: $51,540
- Date on market: 11/9/2026
Estimated market value
Not available
Estimated sales range
Not available
$1,128/mo
Price history
| Date | Event | Price |
|---|---|---|
| 11/9/2026 | Listed for sale | $80,000-15.8%$52/sqft |
Source: Owner Report a problem | ||
| 7/24/2026 | Listing removed | $95,000$62/sqft |
Source: MLS United #4139416 Report a problem | ||
| 7/15/2026 | Listing removed | $1,350$1/sqft |
Source: MLS United #4155633 Report a problem | ||
| 7/13/2026 | Listed for rent | $1,350+2.4%$1/sqft |
Source: MLS United #4155633 Report a problem | ||
| 6/1/2026 | Price change | $95,000-9.5%$62/sqft |
Source: MLS United #4139416 Report a problem | ||
| 2/17/2026 | Listed for sale | $105,000+61.5%$68/sqft |
Source: MLS United #4139416 Report a problem | ||
| 1/15/2026 | Listing removed | $1,318$1/sqft |
Source: Zillow Rentals Report a problem | ||
| 12/30/2025 | Price change | $1,318+5.4%$1/sqft |
Source: Zillow Rentals Report a problem | ||
| 11/16/2025 | Price change | $1,250-10.7%$1/sqft |
Source: Zillow Rentals Report a problem | ||
| 10/16/2025 | Listed for rent | $1,400+9.8%$1/sqft |
Source: Zillow Rentals Report a problem | ||
| 9/10/2025 | Listing removed | $1,275$1/sqft |
Source: Zillow Rentals Report a problem | ||
| 9/10/2025 | Price change | $1,275-12.1%$1/sqft |
Source: Zillow Rentals Report a problem | ||
| 8/29/2025 | Listed for rent | $1,450+20.8%$1/sqft |
Source: Zillow Rentals Report a problem | ||
| 10/5/2024 | Listing removed | $1,200$1/sqft |
Source: Zillow Rentals Report a problem | ||
| 9/17/2024 | Listed for rent | $1,200+4.3%$1/sqft |
Source: Zillow Rentals Report a problem | ||
| 12/12/2023 | Listing removed | -- |
Source: Zillow Rentals Report a problem | ||
| 12/5/2023 | Price change | $1,150-11.5%$1/sqft |
Source: Zillow Rentals Report a problem | ||
| 12/4/2023 | Price change | $1,300-13.3%$1/sqft |
Source: Zillow Rentals Report a problem | ||
| 12/4/2023 | Listing removed | -- |
Source: Owner Report a problem | ||
| 11/28/2023 | Price change | $65,000-18.2%$42/sqft |
Source: Owner Report a problem | ||
| 11/27/2023 | Price change | $79,500-11.7%$52/sqft |
Source: Owner Report a problem | ||
| 11/23/2023 | Listed for rent | $1,500$1/sqft |
Source: Zillow Rentals Report a problem | ||
| 11/18/2023 | Listed for sale | $90,000+500%$59/sqft |
Source: Owner Report a problem | ||
| 10/19/2023 | Sold | -- |
Source: MLS United #4042431 Report a problem | ||
| 10/3/2023 | Pending sale | $15,000$10/sqft |
Source: MLS United #4042431 Report a problem | ||
| 9/27/2023 | Listed for sale | $15,000$10/sqft |
Source: MLS United #4042431 Report a problem | ||
| 7/25/2014 | Sold | -- |
Source: MLS United #1265029 Report a problem | ||
| 8/16/1993 | Sold | -- |
Source: Agent Provided Report a problem | ||
Public tax history
| Year | Property taxes | Tax assessment |
|---|---|---|
| 2025 | -- | $7,731 +2.7% |
| 2024 | -- | $7,527 |
| 2023 | -- | $7,527 |
| 2022 | -- | $7,527 |
| 2021 | -- | $7,527 +0.7% |
| 2020 | -- | $7,473 |
| 2019 | -- | $7,473 |
| 2018 | -- | $7,473 |
| 2017 | $1,378 | $7,473 |
| 2016 | $1,378 | $7,473 +1.5% |
| 2015 | $1,378 +4.6% | $7,362 |
| 2014 | $1,318 | $7,362 |
| 2013 | -- | $7,362 |
| 2012 | -- | $7,362 -3.9% |
| 2011 | -- | $7,658 |
| 2010 | -- | $7,658 |
| 2009 | -- | $7,658 |
| 2008 | -- | $7,658 +24.4% |
| 2007 | -- | $6,156 |
| 2006 | -- | $6,156 |
| 2005 | -- | $6,156 |
| 2004 | -- | $6,156 |
| 2003 | -- | $6,156 |
| 2002 | -- | $6,156 +48.9% |
| 2001 | -- | $4,135 |
| 2000 | -- | $4,135 |
Find assessor info on the county website
Monthly payment
Est. payment
Payment breakdown
Explore the cost of this home by adjusting the details. Changes won't be saved.Climate risks
Neighborhood: Appleridge
Nearby schools
Schools provided by the listing agent
- Elementary: Marshall
- Middle: Peeples
- High: Wingfield
Source: The MLS. This data may not be complete. We recommend contacting the local school district to confirm school assignments for this home.


Similar homes
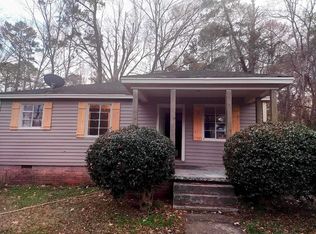
- $70,0002 bd2 ba1.6k sqft825 Combs St, Jackson, MS 39204For Sale By Owner
- $79,9003 bd1 ba1k sqft1310 Maria Dr, Jackson, MS 39204For Sale
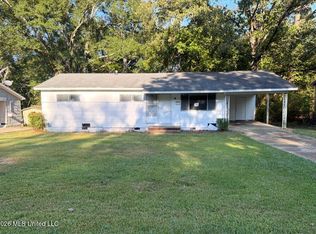 MLS ID #4167743, Anita Orey, Arx Point Realty, LLC. MLS United
- $89,9003 bd2 ba1.8k sqft1551 Wood Glen Dr, Jackson, MS 39204For Sale
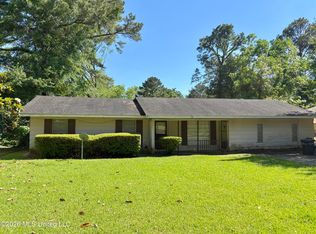 MLS ID #4159425, Tysuela Frazier, W Real Estate LLC. MLS United
- $89,0004 bd2 ba1.8k sqft1757 Southhaven Cir, Jackson, MS 39204For Sale
 MLS ID #4146926, Endia Banks, CPA Realty, LLC. MLS United
