Fully occupied fourplex in South El Monte, offered at $990,000. Four units with 8 bedrooms and 4 bathrooms in total are all occupied, producing verified gross rent of $5,359.60 per month — $64,315.20 per year. Unit 2 has been renovated and commands the building's top rent at $1,800 per month, showing what updated interiors can achieve here. The remaining units rent for $1,270.50 (Unit 1), $1,200.10 (Unit 3), and $1,089 (Unit 4), giving a buyer a stable, in-place income stream from day one and a clear model — Unit 2 — for the value of future updates. Located at 11101 Bonwood Road, South El Monte, CA 91733 (MLS OC26221444). An established multi-unit property for an investor seeking occupied units and documented rent in the San Gabriel Valley. Contact the listing agent for the rent roll and showing details.
For sale
Listed by: NextGen Team Realty • Jonathan Tran • 714-548-8818
$990,000
11101 Bonwood Rd, El Monte, CA 91733
8beds
3,166sqft
Quadruplex
Built in 1957
-- sqft lot
$976,600 Zestimate®
$313/sqft
$-- HOA
What's special
- 31 days
- 552
- 35
Zillow last checked:
Listing updated:
Listed by:
Jonathan Tran DRE #02370675 714-548-8818,
NextGen Team Realty,
John Tran DRE #01359195,
NextGen Team Realty
Source: CRMLS,MLS#: OC26221444 Originating MLS: California Regional MLS
Facts & features
Interior
Bedrooms & bathrooms
- Bedrooms: 8
- Bathrooms: 4
- Full bathrooms: 4
- Main level bathrooms: 3
- Main level bedrooms: 6
Rooms
- Room types: Bedroom, Living Room
Bedroom
- Features: All Bedrooms Down
Bedroom
- Features: All Bedrooms Up
Bathroom
- Features: Tub Shower
Kitchen
- Features: Granite Counters, Tile Counters
Heating
- Wall Furnace
Cooling
- None
Appliances
- Included: Gas Range
- Laundry: None
Features
- Quartz Counters, All Bedrooms Up, All Bedrooms Down
- Flooring: Carpet, Laminate, Tile
- Has fireplace: No
- Fireplace features: None
- Common walls with other units/homes: 2+ Common Walls
Interior area
- Total interior livable area: 3,166 sqft
Property
Parking
- Parking features: Carport
- Has carport: Yes
Accessibility
- Accessibility features: None
Features
- Levels: Two
- Stories: 2
- Entry location: Entrance
- Patio & porch: None
- Pool features: None
- Has view: Yes
- View description: City Lights
Lot
- Size: 6,252 Square Feet
- Features: Near Public Transit
Details
- Parcel number: 8105019029
- Special conditions: Standard
Construction
Type & style
- Home type: MultiFamily
- Property subtype: Quadruplex
- Attached to another structure: Yes
Materials
- Stucco
- Roof: Shingle
Condition
- New construction: No
- Year built: 1957
Utilities & green energy
- Sewer: Public Sewer
- Water: Public
- Utilities for property: Electricity Connected, Natural Gas Connected, Sewer Connected, Water Connected
Community & HOA
Community
- Features: Street Lights, Sidewalks
Location
- Region: El Monte
Financial & listing details
- Price per square foot: $313/sqft
- Tax assessed value: $795,446
- Date on market: 10/12/2026
- Cumulative days on market: 32 days
- Listing terms: Cash to New Loan,Conventional
- Road surface type: Paved
Estimated market value
$976,600
$928,000 - $1.03M
$4,076/mo
Price history
| Date | Event | Price |
|---|---|---|
| 10/12/2026 | Listed for sale | $990,000+1%$313/sqft |
Source:  CRMLS #OC26221444 Report a problem | ||
| 3/11/2025 | Price change | $980,000-0.5%$310/sqft |
Source: CRMLS #OC25053820 Report a problem | ||
| 9/20/2024 | Listed for sale | $985,000-2.5%$311/sqft |
Source: CRMLS #OC24196350 Report a problem | ||
| 8/1/2021 | Listing removed | -- |
Source:  SDMLS #AR21008860 Report a problem | ||
| 7/17/2021 | Contingent | $1,010,000-3.8%$319/sqft |
Source: SDMLS #AR21008860 Report a problem | ||
| 9/28/2020 | Listing removed | $1,050,000$332/sqft |
Source: Elite Realty Group #AR19235253 Report a problem | ||
| 6/10/2020 | Price change | $1,050,000-2.8%$332/sqft |
Source: Elite Realty Group #AR19235253 Report a problem | ||
| 1/22/2020 | Price change | $1,080,000-1.8%$341/sqft |
Source: Elite Realty Group #AR19235253 Report a problem | ||
| 10/8/2019 | Listed for sale | $1,100,000+116.1%$347/sqft |
Source: Elite Realty Group #AR19235253 Report a problem | ||
| 4/26/2010 | Sold | $509,000+12.1%$161/sqft |
Source: Public Record Report a problem | ||
| 6/16/2009 | Sold | $453,900-40.7%$143/sqft |
Source: Public Record Report a problem | ||
| 7/18/2006 | Sold | $765,000+15.9%$242/sqft |
Source: Public Record Report a problem | ||
| 6/28/2005 | Sold | $660,000+25.7%$208/sqft |
Source: Public Record Report a problem | ||
| 12/7/2004 | Sold | $525,000+110%$166/sqft |
Source: Public Record Report a problem | ||
| 3/5/2001 | Sold | $250,000+59.2%$79/sqft |
Source: Public Record Report a problem | ||
| 8/6/1999 | Sold | $157,000-41.6%$50/sqft |
Source: Public Record Report a problem | ||
| 1/15/1999 | Sold | $268,637+3.3%$85/sqft |
Source: Public Record Report a problem | ||
| 2/4/1997 | Sold | $260,000$82/sqft |
Source: Public Record Report a problem | ||
Public tax history
| Year | Property taxes | Tax assessment |
|---|---|---|
| 2026 | -- | $795,446 +2% |
| 2025 | $14,242 +6.8% | $779,854 +2% |
| 2024 | $13,332 +3.8% | $764,568 +2% |
| 2023 | $12,843 +2.2% | $749,582 +2% |
| 2022 | $12,568 +1.4% | $734,890 +2% |
| 2021 | $12,389 +2.9% | $720,486 +1% |
| 2020 | $12,036 | $713,102 +2% |
| 2019 | $12,036 +5% | $699,124 +2% |
| 2018 | $11,460 | $685,420 +2% |
| 2017 | $11,460 +3.1% | $671,776 +2% |
| 2016 | $11,116 +5.2% | $658,604 +1.5% |
| 2015 | $10,566 +3.4% | $648,712 +2% |
| 2014 | $10,216 | $636,006 +2.5% |
| 2012 | -- | $620,718 +2% |
| 2011 | -- | $608,548 +13% |
| 2010 | -- | $538,720 -32.3% |
| 2009 | -- | $795,905 +2% |
| 2008 | -- | $780,300 +2% |
| 2007 | -- | $765,000 +13.6% |
| 2006 | -- | $673,200 +25.7% |
| 2005 | -- | $535,500 +102.1% |
| 2004 | -- | $264,954 +1.9% |
| 2003 | -- | $260,099 +2% |
| 2002 | -- | $255,000 +7.4% |
| 2000 | -- | $237,500 |
Find assessor info on the county website
Monthly payment
Est. payment
Payment breakdown
Explore the cost of this home by adjusting the details. Changes won't be saved.Climate risks
Neighborhood: Mountain View

Similar homes
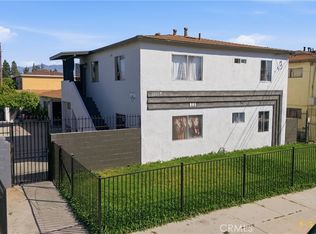
- $999,0006 bd4 ba2.6k sqft11912 Carmenita Rd, Whittier, CA 90605For Sale
 MLS ID #RS26225069, Rosy Vera, Amberwood Real Estate. CRMLS
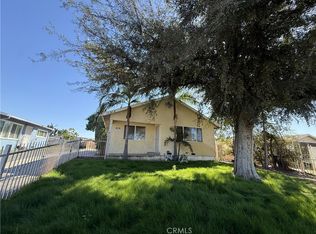
- $969,9008 bd3 ba3.3k sqft2245 Griffin Ave, Los Angeles, CA 90031For Sale
 MLS ID #DW26134891, Saray Tapia, California Homesellers. CRMLS
- $1,388,0007 bd4 ba2.8k sqft12037 Rio Hondo Pkwy, El Monte, CA 91732For Sale
 MLS ID #WS26174696, HENRY LOH, HANDFORE REALTY CORP.. CRMLS
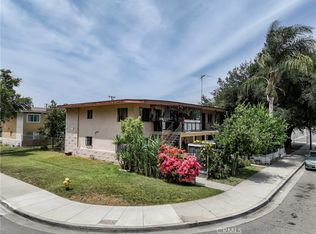
- $950,0008 bd4 ba3.5k sqft1011 W 8th St, Pomona, CA 91766For Sale
 MLS ID #CV26091397, Mauro Trejo, REALTY ONE GROUP MASTERS. CRMLS
