Investor package opportunity! The listed price includes both 2323 Reservoir and 1113/1115 N 14th, which must be purchased together. This package features a 3-bedroom, 1-bath single-family home and a two-unit duplex, offering three potential rental units. All units except one are vacant, providing immediate access to begin renovations. Both properties require work and offer potential for rental income and cash flow once improvements are complete. Additional investment packages are available for buyers looking to expand their portfolio.
For sale
$125,000
1113 N 14th St, Springfield, IL 62702
4beds
2baths
2,290sqft
Multi Family, Duplex
Built in 1924
-- sqft lot
$70,700 Zestimate®
$55/sqft
$-- HOA
What's special
- 1 day
- 77
- 3
Zillow last checked:
Listing updated:
Listed by:
Jami R Winchester Mobl:217-306-1000,
The Real Estate Group, Inc.
Source: RMLS Alliance as distributed by MLS GRID,MLS#: CA1047404 Originating MLS: Capital Area Association of Realtors
Facts & features
Interior
Bedrooms & bathrooms
- Bedrooms: 4
- Bathrooms: 2
Heating
- Forced Air
Cooling
- None, Central Air
Appliances
- Included: Range, Refrigerator, Water Heater
Features
- Basement: Unfinished
Interior area
- Total structure area: 2,290
- Total interior livable area: 2,290 sqft
Property
Parking
- Total spaces: 2
- Parking features: On Street
- Has uncovered spaces: Yes
Lot
- Size: 6,120 Square Feet
- Dimensions: 40 x 153
- Features: Level
Details
- Parcel number: 14270233022
Construction
Type & style
- Home type: MultiFamily
- Property subtype: Multi Family, Duplex
Materials
- Aluminum Siding
- Roof: Shingle
Condition
- New construction: No
- Year built: 1924
Utilities & green energy
- Sewer: Public Sewer
- Water: Public
Community & HOA
Community
- Subdivision: None
Location
- Region: Springfield
Financial & listing details
- Price per square foot: $55/sqft
- Tax assessed value: $62,199
- Annual tax amount: $1,678
- Date on market: 10/28/2026
- Cumulative days on market: 2 days
Estimated market value
$70,700
$51,000 - $93,000
$1,845/mo
Price history
| Date | Event | Price |
|---|---|---|
| 10/28/2026 | Listed for sale | $125,000+150%$55/sqft |
Source:  RMLS Alliance as distributed by MLS GRID #CA1047404 Report a problem | ||
| 5/2/2023 | Sold | $50,000+426.3%$22/sqft |
Source: Public Record Report a problem | ||
| 11/11/2016 | Sold | $9,500-49.7%$4/sqft |
Source: RMLS Alliance as distributed by MLS GRID #CA165461 Report a problem | ||
| 8/23/2016 | Price change | $18,900-29.7%$8/sqft |
Source: Re/Max Professionals #165461 Report a problem | ||
| 7/15/2016 | Price change | $26,900-6.9%$12/sqft |
Source: Re/Max Professionals #165461 Report a problem | ||
| 7/5/2016 | Price change | $28,900-17.2%$13/sqft |
Source: Re/Max Professionals #165461 Report a problem | ||
| 5/18/2016 | Listed for sale | $34,900$15/sqft |
Source: RE/MAX PROFESSIONALS #162928 Report a problem | ||
Public tax history
| Year | Property taxes | Tax assessment |
|---|---|---|
| 2025 | $1,679 +3.4% | $20,733 +7.2% |
| 2024 | $1,624 +29.9% | $19,337 +36.8% |
| 2023 | $1,250 +4% | $14,138 +5.4% |
| 2022 | $1,202 +3.4% | $13,411 +3.9% |
| 2021 | $1,162 +2% | $12,909 -0.1% |
| 2020 | $1,139 +11.4% | $12,928 +0.3% |
| 2019 | $1,023 | $12,883 +6.4% |
| 2018 | $1,023 +2.1% | $12,103 +1.3% |
| 2017 | $1,001 +2% | $11,947 +1.5% |
| 2016 | $982 -52.5% | $11,773 -52.4% |
| 2015 | $2,066 +1.5% | $24,716 +0.7% |
| 2014 | $2,035 +2.3% | $24,556 |
| 2013 | $1,990 +2% | $24,556 |
| 2012 | $1,952 +2.5% | $24,556 |
| 2011 | $1,904 +2.6% | $24,556 +1% |
| 2010 | $1,856 +3% | $24,320 +1.4% |
| 2009 | $1,801 +6% | $23,975 +4.2% |
| 2008 | $1,699 -3.6% | $23,009 -0.2% |
| 2007 | $1,762 +47.6% | $23,061 +50.9% |
| 2006 | $1,194 | $15,287 |
Find assessor info on the county website
Monthly payment
Est. payment
Payment breakdown
Explore the cost of this home by adjusting the details. Changes won't be saved.Climate risks
Neighborhood: Pillsbury

Similar homes
- $119,9003 bd2 ba1.4k sqft1324 Black Ave, Springfield, IL 62702For Sale
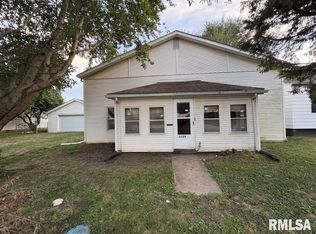
 MLS ID #CA1047085, Khaled Hussein, Keller Williams Capital. RMLS Alliance as distributed by MLS GRID
- $119,9003 bd2 ba1.7k sqft1227 N 3rd St, Springfield, IL 62702For Sale
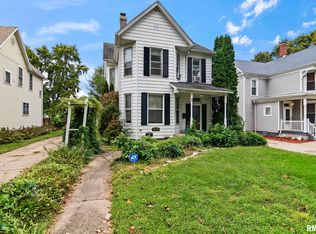 MLS ID #CA1046840, Jim Fulgenzi, RE/MAX Professionals. RMLS Alliance as distributed by MLS GRID
- $125,0003 bd2 ba1.1k sqft2601 Holmes Ave, Springfield, IL 62704For Sale
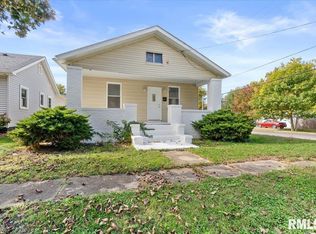 MLS ID #CA1047412, Jerry George, The Real Estate Group, Inc.. RMLS Alliance as distributed by MLS GRID
- $--3 bd2 ba1.4k sqft1119 E Reservoir St, Springfield, IL 62702Auction
 Auction.com 1
- $110,0003 bd2 ba1.3k sqft2133 E Lawrence Ave, Springfield, IL 62703For Sale
 MLS ID #26068642, Wendi Rensing, CCDC Property Management & Real Estate. MARIS
- $124,9993 bd2 ba2k sqft2557 S 6th St, Springfield, IL 62703For SaleMLS ID #CA1047327, Jim Fulgenzi, RE/MAX Professionals. RMLS Alliance as distributed by MLS GRID
- $119,9003 bd2 ba1.1k sqft1827 S 5th St, Springfield, IL 62703For SaleMLS ID #CA1047411, Jerry George, The Real Estate Group, Inc.. RMLS Alliance as distributed by MLS GRID
- $155,0004 bd3 ba2.2k sqft600 Black Ave, Springfield, IL 62702For SaleMLS ID #CA1046183, Jennifer Coady, RE/MAX Professionals. RMLS Alliance as distributed by MLS GRID
- $124,9003 bd3 ba1.4k sqft1814 N 30th St, Springfield, IL 62702For SaleMLS ID #CA1046826, Tracie Taylor, RE/MAX Professionals. RMLS Alliance as distributed by MLS GRID
- $99,9004 bd1 ba1.3k sqft2233 S 10th St, Springfield, IL 62703For SaleMLS ID #CA1047438, John T McIntyre, Do Realty Services, Inc.. RMLS Alliance as distributed by MLS GRID
- $115,0003 bd3 ba1.8k sqft2244 S 9th St, Springfield, IL 62703For SaleMLS ID #CA1046838, Joshua F Kruse, The Real Estate Group, Inc.. RMLS Alliance as distributed by MLS GRID
- $119,9003 bd2 ba1.5k sqft930 N 8th St, Springfield, IL 62702For SaleMLS ID #CA1043667, Linda L Maier, Century 21 Real Estate Assoc. RMLS Alliance as distributed by MLS GRID
- $165,0003 bd2 ba1.8k sqft2600 Selkirk Rd, Springfield, IL 62702For SaleMLS ID #CA1047334, Sarah Quattrin Coombe, Keller Williams Capital. RMLS Alliance as distributed by MLS GRID
- $119,9002 bd2 ba1.2k sqft1131 N 5th St, Springfield, IL 62702For SaleMLS ID #CA1045819, Ben Call, The Real Estate Group, Inc.. RMLS Alliance as distributed by MLS GRID
- $134,0004 bd2 ba1.4k sqft2027 S College St, Springfield, IL 62704For SaleMLS ID #CA1047293, Greg Zessin, Springfield Real Estate, LLC. RMLS Alliance as distributed by MLS GRID
