3 bedroom / 2 bathroom home centrally located in Los Angeles near major transportation, stores, and minutes away from downtown LA
Pending
$600,000
1123 E 67th St, Los Angeles, CA 90001
3beds
1,404sqft
Residential
Built in 1982
5,031 Square Feet Lot
$682,800 Zestimate®
$427/sqft
$-- HOA
What's special
- 987 days
- 3
- 0
Zillow last checked:
Listing updated:
Listed by:
Roxana Solis DRE # 01488001 213-364-1111,
Ernest & Cooper Realty 310-981-7003
Source: CLAW,MLS#: 24-356135
Facts & features
Interior
Bedrooms & bathrooms
- Bedrooms: 3
- Bathrooms: 2
- Full bathrooms: 2
Rooms
- Room types: Breakfast Area
Heating
- Wall Electric
Cooling
- None
Appliances
- Included: Exhaust Fan
- Laundry: In Garage
Features
- Flooring: Laminate
- Has fireplace: No
- Fireplace features: None
Interior area
- Total structure area: 1,404
- Total interior livable area: 1,404 sqft
Property
Parking
- Parking features: Garage - 2 Car
- Has garage: Yes
Features
- Levels: One
- Pool features: None
- Spa features: None
- View description: None
Lot
- Size: 5,031 Square Feet
- Dimensions: 42 x 120
Details
- Additional structures: None
- Parcel number: 6010005029
- Zoning: LCR3*
- Special conditions: Standard
Construction
Type & style
- Home type: SingleFamily
- Property subtype: Residential
Condition
- Year built: 1982
Community & HOA
HOA
- Has HOA: No
Location
- Region: Los Angeles
Financial & listing details
- Price per square foot: $427/sqft
- Tax assessed value: $197,192
- Date on market: 2/7/2024
Estimated market value
$682,800
$621,000 - $744,000
$3,133/mo
Price history
| Date | Event | Price |
|---|---|---|
| 2/8/2024 | Pending sale | $600,000$427/sqft |
Source:  CLAW #24-356135 Report a problem | ||
| 2/7/2024 | Listed for sale | $600,000$427/sqft |
Source: CLAW #24-356135 Report a problem | ||
Public tax history
| Year | Property taxes | Tax assessment |
|---|---|---|
| 2026 | -- | $197,192 +2% |
| 2025 | $3,181 +4.8% | $193,326 +2% |
| 2024 | $3,036 +1.5% | $189,536 +2% |
| 2023 | $2,989 +4.3% | $185,821 +2% |
| 2022 | $2,865 +1.3% | $182,179 +2% |
| 2021 | $2,828 -0.5% | $178,608 +1% |
| 2020 | $2,843 | $176,778 +2% |
| 2019 | $2,843 +7% | $173,313 +2% |
| 2018 | $2,657 | $169,915 +2% |
| 2017 | $2,657 +2% | $166,584 +2% |
| 2016 | $2,605 +2.7% | $163,319 -33.5% |
| 2015 | $2,536 -27.3% | $245,412 +2% |
| 2014 | $3,489 | $240,606 +2.5% |
| 2012 | -- | $234,824 +2% |
| 2011 | -- | $230,220 +53.7% |
| 2010 | -- | $149,783 -0.2% |
| 2009 | -- | $150,140 +2% |
| 2008 | -- | $147,197 +2% |
| 2007 | -- | $144,312 +2% |
| 2006 | -- | $141,484 |
| 2005 | -- | $141,484 +4% |
| 2004 | -- | $135,991 +1.9% |
| 2003 | -- | $133,499 +2% |
| 2002 | -- | $130,882 +4% |
| 2000 | -- | $125,802 |
Find assessor info on the county website
Monthly payment
Est. payment
Payment breakdown
Explore the cost of this home by adjusting the details. Changes won't be saved.Climate risks
Neighborhood: 90001
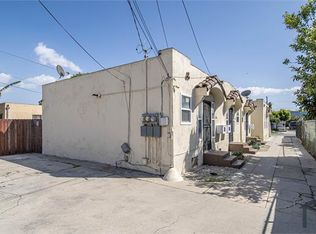

Similar homes
- $--2 bd1 ba860 sqft7635 Maie Ave, Los Angeles, CA 90001Auction
 Auction.com 2
- $--3 bd2 ba1.4k sqft725 Date St, Montebello, CA 90640Auction
 ServiceLink Auction
- $550,0004 bd3 ba1.8k sqft1526 E 77th Pl, Los Angeles, CA 90001For Sale
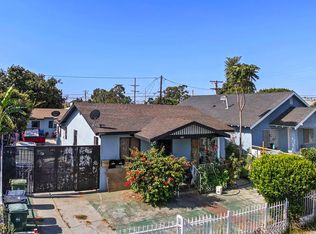 MLS ID #26871219, David Weinberger DRE # 01349349, Keller Williams Studio City. CLAW
- $700,0002 bd5 ba1.2k sqft7408 Elsie St, Los Angeles, CA 90001For Sale
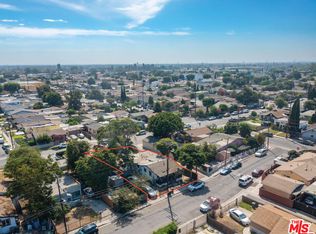 MLS ID #26988461, Casey Lins DRE # 01902650, Kidder Mathews of California, Inc.. CLAW
Local buyer's agents are ready to help
