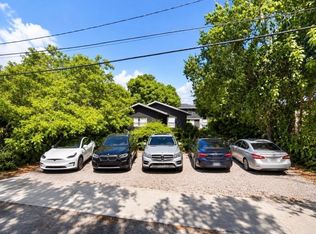
The only fully remodeled, permitted, conforming fourplex in the area under $1M, and it sits in a federal Opportunity Zone. Turnkey, fully leased 4-unit in 33127 with an 8.4% in-place cap rate. Four 1/1 units, separately metered for electric. Remodeled under permit. New roof, impact windows, electrical, plumbing, tankless water heaters, kitchens with Samsung black-stainless appliances, and baths. 40-year recertification complete. Gross income $83,400/yr, with rents below the $2,040 Section 8 payment standard: up to $19,320/yr of upside on turnover. Blocks from Related Urban's Liberty Square redevelopment and minutes from the planned Little River district, future Tri-Rail station, Wynwood, and the Design District. 5,680 sf lot with parking for 4. Buy it and collect.
For sale
$799,000
1126 NW 58th Ter, Miami, FL 33127
4beds
4baths
1,980sqft
Quadruplex
Built in 1936
-- sqft lot
$753,700 Zestimate®
$404/sqft
$-- HOA
What's special
Fully remodeledNew roofImpact windowsTankless water heaters
- 24 days
- 281
- 34
Likely to sell faster than
Zillow last checked:
Listing updated:
Listed by:
Jose Safdie 305-399-8241,
Beachfront Realty Inc
Source: MIAMI,MLS#: A12111480 Originating MLS: A-Miami Association of REALTORS
Facts & features
Interior
Bedrooms & bathrooms
- Bedrooms: 4
- Bathrooms: 4
Heating
- Electric
Cooling
- Electric
Features
- Flooring: Vinyl
Interior area
- Total structure area: 1,980
- Total interior livable area: 1,980 sqft
Video & virtual tour
Property
Parking
- Total spaces: 4
Features
- Stories: 1
Lot
- Features: Less Than 1/4 Acre Lot
Details
- Parcel number: 0131140230341
- Zoning: 5700
Construction
Type & style
- Home type: MultiFamily
- Property subtype: Quadruplex
Materials
- Frame With Stucco
- Roof: Shingle
Condition
- Year built: 1936
Utilities & green energy
- Sewer: Public Sewer
- Water: Municipal Water
Community & HOA
Community
- Subdivision: Gabel Sub No 4
HOA
- Has HOA: No
Location
- Region: Miami
Financial & listing details
- Price per square foot: $404/sqft
- Tax assessed value: $450,000
- Annual tax amount: $9,299
- Date on market: 10/22/2026
- Listing terms: All Cash,Conventional
- Total actual rent: 78600
Estimated market value
$753,700
$716,000 - $791,000
$3,422/mo
Price history
| Date | Event | Price |
|---|---|---|
| 10/27/2026 | Listed for sale | $799,000-20.1%$404/sqft |
Source:  MIAMI #A12111480 Report a problem | ||
| 5/30/2026 | Listing removed | $1,000,000$505/sqft |
Source:  Douglas Elliman #A11938166 Report a problem | ||
| 4/17/2026 | Listed for sale | $1,000,000$505/sqft |
Source: MIAMI #A11938166 Report a problem | ||
| 3/25/2026 | Listing removed | $1,000,000$505/sqft |
Source: Douglas Elliman #A11938166 Report a problem | ||
| 3/18/2026 | Price change | $1,000,000-22.5%$505/sqft |
Source: MIAMI #A11938166 Report a problem | ||
| 1/5/2026 | Listed for sale | $1,290,000+168.8%$652/sqft |
Source: MIAMI #A11938166 Report a problem | ||
| 7/26/2025 | Listing removed | $1,795$1/sqft |
Source: Zillow Rentals Report a problem | ||
| 5/15/2025 | Listed for rent | $1,795$1/sqft |
Source: Zillow Rentals Report a problem | ||
| 3/8/2024 | Listing removed | -- |
Source: MIAMI #A11478942 Report a problem | ||
| 2/12/2024 | Listed for rent | $1,795$1/sqft |
Source: MIAMI #A11478942 Report a problem | ||
| 11/19/2023 | Listing removed | -- |
Source: MIAMI #A11478942 Report a problem | ||
| 11/1/2023 | Listed for rent | $1,795-10%$1/sqft |
Source: MIAMI #A11478942 Report a problem | ||
| 11/1/2023 | Listing removed | -- |
Source: MIAMI #A11478150 Report a problem | ||
| 10/30/2023 | Price change | $1,995+66.9%$1/sqft |
Source: MIAMI #A11478150 Report a problem | ||
| 10/30/2023 | Price change | $1,195-45.6%$1/sqft |
Source: MIAMI #A11471154 Report a problem | ||
| 10/18/2023 | Listed for rent | $2,195$1/sqft |
Source: MIAMI #A11471154 Report a problem | ||
| 8/29/2022 | Sold | $480,000+306.8%$242/sqft |
Source: Public Record Report a problem | ||
| 9/18/2013 | Sold | $118,000+31.1%$60/sqft |
Source: Public Record Report a problem | ||
| 7/3/2013 | Sold | $90,000-27.7%$45/sqft |
Source: Public Record Report a problem | ||
| 1/24/2013 | Listed for sale | $124,500-0.4%$63/sqft |
Source: MJM Capital Realty, Inc. #A1619975 Report a problem | ||
| 3/23/2012 | Listed for sale | $125,000-21.8%$63/sqft |
Source: MJM Capital Realty, Inc. #A1619975 Report a problem | ||
| 11/17/2004 | Sold | $159,900+27.9%$81/sqft |
Source: Public Record Report a problem | ||
| 7/25/2003 | Sold | $125,000$63/sqft |
Source: Public Record Report a problem | ||
Public tax history
| Year | Property taxes | Tax assessment |
|---|---|---|
| 2025 | $9,299 +10.4% | $443,814 +14% |
| 2024 | $8,420 -11.2% | $389,275 -15.6% |
| 2023 | $9,478 +67% | $461,067 +67.5% |
| 2022 | $5,675 +33.2% | $275,290 +41.3% |
| 2021 | $4,260 +8.9% | $194,889 +10% |
| 2020 | $3,913 +11.8% | $177,172 +10% |
| 2019 | $3,501 +11% | $161,066 +10% |
| 2018 | $3,153 | $146,424 +10% |
| 2017 | $3,153 +6.4% | $133,113 +10% |
| 2016 | $2,963 +44.9% | $121,012 +31.6% |
| 2015 | $2,045 +0.1% | $91,953 +2.1% |
| 2014 | $2,043 +17.9% | $90,068 +24.4% |
| 2013 | $1,733 | $72,419 -5.6% |
| 2012 | $1,733 -3.8% | $76,705 -3.2% |
| 2011 | $1,802 -11.6% | $79,200 -5.9% |
| 2010 | $2,038 -15% | $84,189 -19.3% |
| 2009 | $2,399 -22.5% | $104,326 -25.3% |
| 2007 | $3,094 +14.8% | $139,666 |
| 2006 | $2,695 | -- |
| 2005 | $2,695 +16% | -- |
| 2004 | $2,324 +37.7% | -- |
| 2003 | $1,688 +8.9% | -- |
| 2002 | $1,550 | -- |
| 2001 | $1,550 | -- |
Find assessor info on the county website
Monthly payment
Est. payment
Payment breakdown
Explore the cost of this home by adjusting the details. Changes won't be saved.Climate risks
Neighborhood: Liberty City


Similar homes
- $850,0004 bd3 ba2.4k sqft21 NE 53rd St, Miami, FL 33137For Sale By Owner
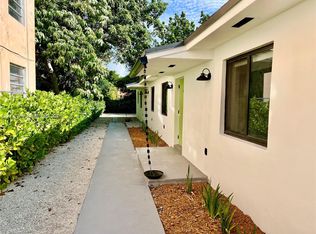
- $925,0006 bd4 ba2.1k sqftRailway Shops Addn 2nd Am, Miami, FL 33127For Sale
 MLS ID #A12120369, Victor Beraja, Magasi Real Estate, LLC.. MIAMI
- $593,0004 bd3 ba1.2k sqft7th Avenue Highlands, Miami, FL 33150For Sale
 MLS ID #A12114681, Dairon Rubio Castro, Interinvestments Realty, Inc.. MIAMI
- $799,9995 bd4 ba1.9k sqftOverbrook Shores No-2, North Miami, FL 33168For Sale
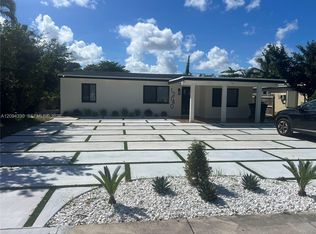 MLS ID #A12094330, Frantz Desir, The Moreno Property Group, LLC.. MIAMI
- $839,0005 bd2 ba1.7k sqftLawrence Est Land Cos Sub, Miami, FL 33130For SaleMLS ID #A12052808, Jorge Vazquez, RE/MAX United Realty. MIAMI
- $779,9954 bd3 ba1.8k sqftSun-Tan Village Sec 1, Hialeah, FL 33010For SaleMLS ID #A12087920, Liliam Brito, A & B Realty Investments Inc. MIAMI
- $699,0004 bd2 ba1.5k sqftGreen Oaks, North Miami, FL 33161For SaleMLS ID #A12115372, Stephanie Haave, GG International Realty. MIAMI
- $595,0006 bd4 ba1.7k sqftStephen Manor, Miami, FL 33150For SaleMLS ID #A12035975, Lorenzo Ramos, Coldwell Banker Realty. MIAMI
- $599,9993 bd3 ba1.4k sqftSeventh Ave Park, Miami, FL 33150For SaleMLS ID #A12087278, Adrian Rodriguez, Opulent Real Estate, Inc. MIAMI
- $745,0005 bd4 ba1.6k sqftW Flagler Pk, Miami, FL 33126For SaleMLS ID #A12090147, Yaselis Rodriguez Garcia, Xcellence. MIAMI
- $679,9995 bd4 ba2.3k sqftYvette Condo, Miami, FL 33125For SaleMLS ID #A12090948, Alejandra Rodriguez Venegas, Casa Collective Realty. MIAMI
- $718,0005 bd3 ba2.1k sqftCoral Villas Rev, Miami, FL 33155For SaleMLS ID #A12113469, Cibele Zuazu, LoKation. MIAMI
- $925,0004 bd2 ba1k sqftMc Allister Terr Amend, Miami, FL 33145For SaleMLS ID #A12075941, Miguel Marino, Cespedes Realty LLC. MIAMI
- $889,0003 bd2 ba1.5k sqftDurniers, Miami, FL 33145For SaleMLS ID #A12101582, Gianni Perocarpi, Coldwell Banker Realty. MIAMI
- $1,195,0004 bd2 ba1.6k sqftBiltmore Sub, Miami, FL 33137For SaleMLS ID #A11987182, Lucia Hermoso, Coldwell Banker Realty. MIAMI
- $670,0004 bd4 ba1.9k sqftAcme Gulfair 2nd Addn, Miami, FL 33147For SaleMLS ID #A12061522, Hugo Hernandez, LPT Realty, LLC. MIAMI
- $760,0003 bd2 ba1.2k sqftPasadena Park Sub, Miami, FL 33161For SaleMLS ID #A12079213, Armando Dominguez Lambert, SEI Brokers Corporation. MIAMI
- $658,8003 bd2 ba1.3k sqftSunny Acres, North Miami, FL 33161For SaleMLS ID #A12114832, Andrea Fernandez, Bruckman Realty, LLC. MIAMI
- $950,0004 bd2 ba1.9k sqftBiscayne Bch Sub, Miami Beach, FL 33141For SaleMLS ID #A11944410, Pedro Saavedra, South Pointe Drive Realty Inc. MIAMI
- $885,0004 bd3 ba1.7k sqftWest Garden Sub, Sweetwater, FL 33174For SaleMLS ID #A12120403, Jesus Sansonetti, Avanti Way Brickell. MIAMI
