Welcome to an exceptional investment opportunity that checks every box: prime location, strong performance, and outstanding long-term potential. This charming, 6 bedrooms, 3 bathrooms, fully rented triplex is ideally situated in a highly desirable Magnolia district, just a short walk from award-winning schools, including University Preparatory and Shasta High, and vibrant downtown, offering unmatched convenience to top-rated restaurants, popular shopping destinations, major hospitals and medical offices.
Designed to attract and retain quality tenants, the property benefits from a strong cash flow, consistently low vacancy rates, and an impressive cap rate, making it a true standout in today's market.
Whether you're expanding your portfolio or securing your first multi-family investment, this property offers the perfect blend of location, performance, and future appreciation potential. Opportunities like this are rare - don't miss your chance to own a high-performing asset in a prime highly desirable location.
For sale
$385,000
1129 Magnolia Ave, Redding, CA 96001
--beds
--baths
--sqft
Multi Family
Built in 1925
-- sqft lot
$378,200 Zestimate®
$--/sqft
$-- HOA
What's special
- 19 days
- 534
- 31
Zillow last checked:
Listing updated:
Listed by:
Liudmila D Kovalchuk 530-806-6855,
Coldwell Banker Select Real Estate - Redding
Source: SMLS,MLS#: 26-5447
Facts & features
Interior
Heating
- Electric
Features
- Has basement: No
Property
Parking
- Parking features: Off Street, On Street
- Has uncovered spaces: Yes
Features
- Stories: 2
Lot
- Size: 5,227 Square Feet
- Dimensions: 5,227
Details
- Parcel number: 105280009000
Construction
Type & style
- Home type: MultiFamily
- Property subtype: Multi Family
Condition
- Year built: 1925
Community & HOA
HOA
- Has HOA: No
Location
- Region: Redding
Financial & listing details
- Tax assessed value: $363,239
- Date on market: 9/30/2026
- Ownership: Seller
Estimated market value
$378,200
$359,000 - $397,000
$1,449/mo
Price history
| Date | Event | Price |
|---|---|---|
| 9/30/2026 | Listed for sale | $385,000-9.4% |
Source:  SMLS #26-5447 Report a problem | ||
| 9/27/2026 | Listing removed | $425,000 |
Source: SMLS #26-1298 Report a problem | ||
| 3/26/2026 | Listed for sale | $425,000+7.6% |
Source: SMLS #26-1298 Report a problem | ||
| 6/1/2025 | Listing removed | $395,000 |
Source: SMLS #24-4887 Report a problem | ||
| 3/19/2025 | Price change | $395,000-5.7% |
Source: SMLS #24-4887 Report a problem | ||
| 3/5/2025 | Listed for sale | $419,000 |
Source: SMLS #24-4887 Report a problem | ||
| 2/18/2025 | Pending sale | $419,000 |
Source: SMLS #24-4887 Report a problem | ||
| 11/17/2024 | Listed for sale | $419,000-1.4% |
Source: SMLS #24-4887 Report a problem | ||
| 8/9/2024 | Listing removed | -- |
Source: SMLS #24-914 Report a problem | ||
| 6/6/2024 | Price change | $425,000-3.2% |
Source: SMLS #24-914 Report a problem | ||
| 5/9/2024 | Listed for sale | $439,000-1.6% |
Source: SMLS #24-914 Report a problem | ||
| 3/28/2024 | Listing removed | -- |
Source: SMLS #24-914 Report a problem | ||
| 3/7/2024 | Listed for sale | $445,988 |
Source: SMLS #24-914 Report a problem | ||
| 3/3/2024 | Listing removed | $445,988 |
Source: SMLS #23-3136 Report a problem | ||
| 2/14/2024 | Price change | $445,988+0% |
Source: SMLS #23-3136 Report a problem | ||
| 1/28/2024 | Listed for sale | $445,888-4.7% |
Source: SMLS #23-3136 Report a problem | ||
| 12/14/2023 | Listing removed | -- |
Source: SMLS #23-3136 Report a problem | ||
| 10/26/2023 | Listed for sale | $468,000 |
Source: SMLS #23-3136 Report a problem | ||
| 10/12/2023 | Listing removed | -- |
Source: SMLS #23-3136 Report a problem | ||
| 9/25/2023 | Listed for sale | $468,000-2.3% |
Source: SMLS #23-3136 Report a problem | ||
| 9/13/2023 | Listing removed | -- |
Source: SMLS #23-3136 Report a problem | ||
| 8/5/2023 | Listed for sale | $479,000+45.6% |
Source: SMLS #23-3136 Report a problem | ||
| 6/11/2021 | Sold | $329,000+9.8% |
Source: SMLS #21-2294 Report a problem | ||
| 5/17/2021 | Listed for sale | $299,500+171.7% |
Source: SMLS #21-2294 Report a problem | ||
| 3/24/2014 | Sold | $110,250-29.6% |
Source: SMLS #14-892 Report a problem | ||
| 12/16/2013 | Sold | $156,504-39.8% |
Source: Public Record Report a problem | ||
| 8/25/2005 | Sold | $260,000+40.9% |
Source: Public Record Report a problem | ||
| 7/22/2004 | Sold | $184,500+101.6% |
Source: Public Record Report a problem | ||
| 3/26/1999 | Sold | $91,500 |
Source: Public Record Report a problem | ||
Public tax history
| Year | Property taxes | Tax assessment |
|---|---|---|
| 2026 | -- | $363,239 +2% |
| 2025 | $3,749 +1.4% | $356,118 +2% |
| 2024 | $3,696 +1.5% | $349,136 +2% |
| 2023 | $3,641 +1.7% | $342,291 +2% |
| 2022 | $3,580 +158.7% | $335,580 +168.8% |
| 2021 | $1,384 -1.3% | $124,851 +1% |
| 2020 | $1,402 +5.2% | $123,572 +2% |
| 2019 | $1,332 -0.8% | $121,150 +2% |
| 2018 | $1,343 +0.5% | $118,776 +2% |
| 2017 | $1,336 +3.2% | $116,448 +2% |
| 2016 | $1,294 +1.3% | $114,166 +1.5% |
| 2015 | $1,278 | $112,452 |
Find assessor info on the county website
Monthly payment
Est. payment
Payment breakdown
Explore the cost of this home by adjusting the details. Changes won't be saved.Climate risks
Neighborhood: 96001


Similar homes
- $485,0004 bd2 ba1.8k sqft1259-1261 Magnolia Ave, Redding, CA 96001For Sale
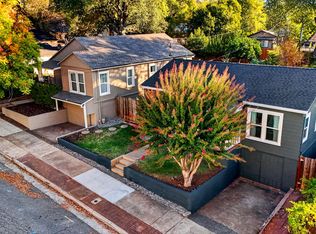 MLS ID #26-5676, Elisabeth Peery. SMLS
- $379,9003 bd2 ba1.5k sqft3330 Stratford Ave, Redding, CA 96001For Sale
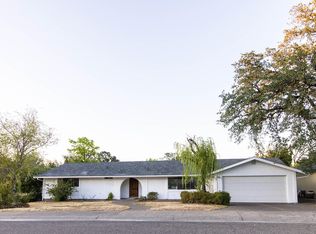 MLS ID #26-3742, J.R. McGee. SMLS
- $375,0004 bd2 ba1.5k sqft3605 Summit Dr, Redding, CA 96001For Sale
 MLS ID #26-4768, Darren L Stevens. SMLS
- $315,0003 bd2 ba1.7k sqft1330 Scenic Way, Redding, CA 96001For Sale
 MLS ID #26-6438, Zachary R Wusstig. SMLS
