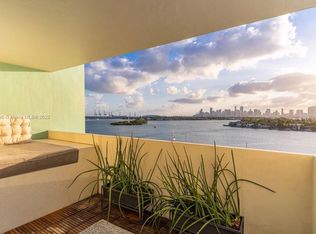
I bought this condo as my first home, and I chose it very intentionally. I was looking for the things I didn’t want to compromise on: an unobstructed view with Miami greenery, a real balcony, walking distance to the beach, and everyday convenience. Somehow, I found all of it here. Whole Foods is literally across the street, tennis courts are nearby, the beach is about a 10-minute walk away, and the building has a pool and one dedicated parking space.
Since buying it, I’ve invested nearly $80,000 into the property and building improvements, including a new roof, new balcony, hurricane-impact windows, and the addition/improvement of an in-unit washer and dryer. But what I value most about this home is something you cannot put on an inspection report: the way it feels. As a yogi and meditation teacher, I’m very sensitive to my surroundings, so over the years I consciously created a peaceful, grounding home here—meditating, praying, gathering friends, sharing beautiful evenings and filling the space with life. People who stay here often tell me they don’t want to leave. It has become my little Miami retreat: calm and private, yet right in the middle of everything. One of my favorite rituals is walking to the canal in the evening, watching the sunset with a cup of tea from Pura Vida. It’s such a simple thing, but honestly one of the gems of living here.
I’m selling only because I’m ready for the next chapter and need more space for the family I want to create. This is not a distressed sale, and I’m not in a rush—the condo also rents very well. The price reflects what I paid for the property plus the substantial improvements I’ve made, so I’m looking for the right buyer rather than simply the fastest offer.
If you’re looking for more than square footage—a home with light, greenery, a balcony, parking, a pool, tennis nearby, Whole Foods across the street, the beach within walking distance, and those beautiful Miami sunset evenings by the water—come see it in person. Some homes make sense on paper. This one makes sense the moment you walk in.
Please reach out for a showing.
For sale by owner
$330,000
1130 11th St APT 6H, Miami Beach, FL 33139
1beds
890sqft
Condo
Built in 1968
-- sqft lot
$-- Zestimate®
$371/sqft
$795/mo HOA
What's special
Real balconyNew balconyNew roofBuilding has a poolIn-unit washer and dryerPeaceful grounding homeHurricane-impact windows
What the owner loves about this home
The coziness and tranquility.
Every morning I meditate on my balcony and can hear birds chirping:)
- 20 days
- 451
- 32
Listed by:
Property Owner (917) 607-0747
Facts & features
Interior
Bedrooms & bathrooms
- Bedrooms: 1
- Bathrooms: 2
- Full bathrooms: 1
- 1/2 bathrooms: 1
Heating
- Forced air
Cooling
- Other
Appliances
- Included: Dryer, Freezer, Microwave, Refrigerator, Washer
Features
- Furnished: Yes
Interior area
- Total interior livable area: 890 sqft
Property
Parking
- Total spaces: 1
- Parking features: Garage - Detached
Details
- Parcel number: 0242030590480
Construction
Type & style
- Home type: Condo
Condition
- New construction: No
- Year built: 1968
Community & HOA
Community
- Features: On Site Laundry Available
HOA
- Has HOA: Yes
- HOA fee: $795 monthly
Location
- Region: Miami Beach
Financial & listing details
- Price per square foot: $371/sqft
- Tax assessed value: $222,881
- Annual tax amount: $3,400
- Date on market: 10/3/2026
Estimated market value
Not available
Estimated sales range
Not available
$3,716/mo
Price history
| Date | Event | Price |
|---|---|---|
| 10/3/2026 | Listed for sale | $330,000+10.4%$371/sqft |
Source: Owner Report a problem | ||
| 9/23/2026 | Listing removed | $3,100$3/sqft |
Source: Zillow Rentals Report a problem | ||
| 8/26/2026 | Listed for rent | $3,100+14.8%$3/sqft |
Source: Zillow Rentals Report a problem | ||
| 2/2/2026 | Listing removed | $299,000$336/sqft |
Source:  MIAMI #A11812788 Report a problem | ||
| 10/14/2025 | Price change | $299,000-12.1%$336/sqft |
Source: MIAMI #A11812788 Report a problem | ||
| 6/20/2025 | Listing removed | $2,700$3/sqft |
Source: Zillow Rentals Report a problem | ||
| 5/30/2025 | Listed for sale | $340,000+13.7%$382/sqft |
Source: MIAMI #A11812788 Report a problem | ||
| 4/30/2025 | Listing removed | $299,000$336/sqft |
Source: MIAMI #A11790443 Report a problem | ||
| 4/24/2025 | Listed for sale | $299,000-10.7%$336/sqft |
Source: MIAMI #A11790443 Report a problem | ||
| 4/24/2025 | Price change | $2,700+8%$3/sqft |
Source: Zillow Rentals Report a problem | ||
| 4/22/2025 | Listed for rent | $2,500-16.6%$3/sqft |
Source: Zillow Rentals Report a problem | ||
| 12/18/2024 | Listing removed | $2,999$3/sqft |
Source: Zillow Rentals Report a problem | ||
| 12/18/2024 | Price change | $2,999-9.1%$3/sqft |
Source: Zillow Rentals Report a problem | ||
| 12/13/2024 | Price change | $3,300+22.2%$4/sqft |
Source: Zillow Rentals Report a problem | ||
| 11/26/2024 | Price change | $2,700-18.2%$3/sqft |
Source: Zillow Rentals Report a problem | ||
| 10/28/2024 | Price change | $3,300-5.7%$4/sqft |
Source: Zillow Rentals Report a problem | ||
| 10/13/2024 | Listed for rent | $3,499+40%$4/sqft |
Source: Zillow Rentals Report a problem | ||
| 6/1/2024 | Listing removed | -- |
Source: Zillow Rentals Report a problem | ||
| 5/23/2024 | Price change | $2,499-7.4%$3/sqft |
Source: Zillow Rentals Report a problem | ||
| 5/13/2024 | Listed for rent | $2,700$3/sqft |
Source: Zillow Rentals Report a problem | ||
| 12/2/2023 | Listing removed | -- |
Source: MIAMI #A11432939 Report a problem | ||
| 12/1/2023 | Listed for sale | $335,000+35.6%$376/sqft |
Source: MIAMI #A11432939 Report a problem | ||
| 9/7/2023 | Listing removed | -- |
Source: MIAMI #A11432939 Report a problem | ||
| 2/23/2022 | Sold | $247,000+31.6%$278/sqft |
Source: MIAMI #A11143904 Report a problem | ||
| 8/25/2015 | Sold | $187,700$211/sqft |
Source: Public Record Report a problem | ||
Public tax history
| Year | Property taxes | Tax assessment |
|---|---|---|
| 2025 | $3,400 -17.5% | $222,881 -14.5% |
| 2024 | $4,124 -0.4% | $260,679 +19% |
| 2023 | $4,139 +68% | $219,058 +27.1% |
| 2022 | $2,463 +0.9% | $172,344 +3% |
| 2021 | $2,441 +1.5% | $167,325 +1.4% |
| 2020 | $2,405 -6.6% | $165,015 -5% |
| 2019 | $2,576 -8.2% | $173,700 -8.7% |
| 2018 | $2,805 | $190,232 |
| 2017 | $2,805 -1.4% | $190,232 |
| 2016 | $2,845 -11.7% | $190,232 +20.3% |
| 2015 | $3,222 +3% | $158,092 +10% |
| 2014 | $3,128 +28.7% | $143,720 +10% |
| 2013 | $2,431 | $130,655 +10% |
| 2012 | $2,431 +8.8% | $118,778 +10% |
| 2011 | $2,235 -15.6% | $107,980 -10% |
| 2010 | $2,648 +7.3% | $119,980 |
| 2009 | $2,468 -49% | $119,980 -50% |
| 2007 | $4,841 +29.6% | $239,950 |
| 2006 | $3,735 | -- |
| 2005 | $3,735 +12.8% | -- |
| 2004 | $3,310 +57.4% | -- |
| 2003 | $2,103 +34.3% | -- |
| 2002 | $1,565 | -- |
| 2001 | $1,565 | -- |
Find assessor info on the county website
Monthly payment
Est. payment
Payment breakdown
Explore the cost of this home by adjusting the details. Changes won't be saved.Climate risks
Neighborhood: Star island
- $240,4001 bd1 ba640 sqft3 Island Ave APT 12A, Miami Beach, FL 33139Off Market

- $1,500,0002 bd2 ba1 sqft5 Island Ave APT 10C, Miami Beach, FL 33139For Sale By Owner
- $282,2001 bd1 ba690 sqft1245 West Ave APT 204, Miami Beach, FL 33139Off Market
- $355,0002 bd1 ba879 sqft1820 James Ave APT 5F, Miami Beach, FL 33139For Sale By Owner
Similar homes
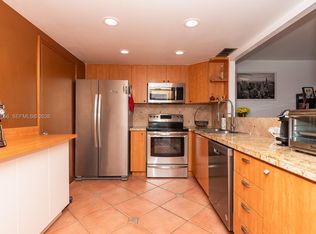
- $365,0001 bd2 ba890 sqftAdmiral Towers Condo Asso, Miami Beach, FL 33139For Sale
 MLS ID #A12102656, Juan Carlos Guzman Martinez, EquiEstate, Corp.. MIAMI
- $316,8881 bd2 ba687 sqftAlton Star Condo, Miami Beach, FL 33139For Sale
 MLS ID #A11974788, Raquel Tuch Bussey, Avanti Way Brickell. MIAMI
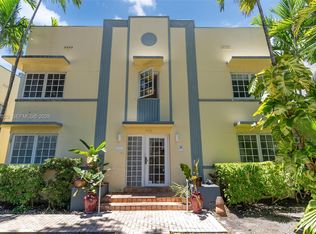
- $348,9902 bd2 ba825 sqftEuclid 600 Condo, Miami Beach, FL 33139For Sale
 MLS ID #A12072029, Gustavo Moreira, EXP Realty South LLC. MIAMI
- $318,0001 bd1 ba506 sqftSherita Condo, Miami Beach, FL 33139For Sale
 MLS ID #A12077401, Alejandro Tabosky, Brokers, LLC. MIAMI
- $389,0002 bd2 ba900 sqftJefferson Court Condo, Miami Beach, FL 33139For SaleMLS ID #A12078919, Jacqueline Reeves, Condoideas Realty Group LLC. MIAMI
- $298,7501 bd1 ba585 sqftFriendly Corner, Miami Beach, FL 33139For SaleMLS ID #A12063841, Danell Van Orden, The Keyes Company. MIAMI
- $399,0002 bd2 ba820 sqftLincoln West Towers, Miami Beach, FL 33139For SaleMLS ID #A12017432, Richard Corrales, Silverleaf Realty Group. MIAMI
- $319,0001 bd1 ba600 sqftTriton Tower Condo, Miami Beach, FL 33140For SaleMLS ID #A12105169, Steven Yuskaitis, Keller Williams Capital Realty. MIAMI
- $281,9001 bd1 ba650 sqftTower East, Miami Beach, FL 33139For SaleMLS ID #A12023024, Olena Bondarchuck, Related General Realty, LLC.. MIAMI
- $415,0002 bd2 ba1.1k sqftFlamingo Wave Condo, Miami Beach, FL 33139For SaleMLS ID #A12090967, Monique Freitas, Trident Real Estate, Inc. MIAMI
- $449,0001 bd2 ba675 sqft1390 Ocean Drive, Miami Beach, FL 33139For SaleMLS ID #A12083090, Franck Aravya, Beachfront Realty Inc. MIAMI
- $279,5001 bd1 ba536 sqftWhisper Condo, Miami Beach, FL 33139For SaleMLS ID #A11854715, Banna Fakhoury, One Sotheby's International Realty. MIAMI
- $225,0001 bd1 ba540 sqftThe Flamingo Condo, Miami Beach, FL 33139For SaleMLS ID #A12083402, Daniel Falcon, Gary Hennes Realtors. MIAMI
- $209,0001 bd1 ba540 sqftThe Flamingo Condo, Miami Beach, FL 33139For SaleMLS ID #A12098143, Teodoro Palmieri, Elite Ocean View Realty LLC. MIAMI
- $215,0001 bd1 ba520 sqftThe Fenimore Condo, Miami Beach, FL 33139For SaleMLS ID #A12100831, Jerome Cherki, Compass Florida, LLC. MIAMI
- $275,000-- bd1 ba550 sqftEspanola Court Condo, Miami Beach, FL 33139For SaleMLS ID #A12039949, T Kimberly Rodstein, Douglas Elliman. MIAMI
- $485,0002 bd2 ba1k sqftParc Plaza Condo, Miami Beach, FL 33139For SaleMLS ID #A12080788, Lissette Otalvaro, Real Broker, LLC. MIAMI
- $375,0002 bd2 ba720 sqftLake Beach Club, Miami Beach, FL 33140For SaleMLS ID #A12067447, Sarah Desamours, Compass Florida, LLC. MIAMI
- $475,0002 bd2 ba1.1k sqftLincoln Towers Condo, Miami Beach, FL 33139For SaleMLS ID #A11681962, Lila Lopez, RE/MAX 360 Real Estate. MIAMI
- $299,0001 bd1 ba728 sqftRiviera Towers Condo, Miami, FL 33137For SaleMLS ID #A11487314, Frank Gonzalez, Real Estate Sales Force. MIAMI
