This 2603 square foot single family home has 4 bedrooms and 3.0 bathrooms. This home is located at 1145 Sabal St, Sanibel, FL 33957.
Pre-foreclosure
Street View
Est. $911,700
1145 Sabal St, Sanibel, FL 33957
4beds
3baths
2,603sqft
SingleFamily
Built in 1969
0.31 Acres Lot
$911,700 Zestimate®
$350/sqft
$4/mo HOA
Overview
- 127 days
- 53
- 0
Facts & features
Interior
Bedrooms & bathrooms
- Bedrooms: 4
- Bathrooms: 3
Heating
- Forced air
Cooling
- Central
Features
- Flooring: Other
Interior area
- Total interior livable area: 2,603 sqft
Property
Parking
- Parking features: Garage - Attached
Features
- Exterior features: Other, Stucco
Lot
- Size: 0.31 Acres
Details
- Parcel number: 204623T3018040020
Construction
Type & style
- Home type: SingleFamily
Materials
- Frame
- Roof: Asphalt
Condition
- Year built: 1969
Community & HOA
HOA
- Has HOA: Yes
- HOA fee: $4 monthly
Location
- Region: Sanibel
Financial & listing details
- Price per square foot: $350/sqft
- Tax assessed value: $825,803
- Annual tax amount: $12,196
Foreclosure details
Estimated market value
$911,700
$784,000 - $1.06M
$7,112/mo
Price history
| Date | Event | Price |
|---|---|---|
| 4/12/2023 | Sold | $650,000-17.7%$250/sqft |
Source:  Florida Gulf Coast MLS #223005363 Report a problem | ||
| 3/20/2023 | Pending sale | $790,000$303/sqft |
Source:  Florida Gulf Coast MLS #223005363 Report a problem | ||
| 3/14/2023 | Listed for sale | $790,000$303/sqft |
Source: Florida Gulf Coast MLS #223005363 Report a problem | ||
| 3/13/2023 | Pending sale | $790,000$303/sqft |
Source: Florida Gulf Coast MLS #223005363 Report a problem | ||
| 3/10/2023 | Price change | $790,000-6.9%$303/sqft |
Source: Florida Gulf Coast MLS #223005363 Report a problem | ||
| 3/1/2023 | Price change | $849,000-3.4%$326/sqft |
Source: Florida Gulf Coast MLS #223005363 Report a problem | ||
| 2/17/2023 | Price change | $879,000-1.8%$338/sqft |
Source:  Sanibel And Captiva Island AOR #2230134 Report a problem | ||
| 1/27/2023 | Listed for sale | $895,000+204.9%$344/sqft |
Source: Florida Gulf Coast MLS #223005363 Report a problem | ||
| 8/20/1997 | Sold | $293,500+95.7%$113/sqft |
Source: Public Record Report a problem | ||
| 8/31/1993 | Sold | $150,000$58/sqft |
Source: Public Record Report a problem | ||
Public tax history
| Year | Property taxes | Tax assessment |
|---|---|---|
| 2025 | $12,196 +49.3% | $825,803 +53% |
| 2024 | $8,168 +21.1% | $539,774 +12.1% |
| 2023 | $6,743 +7% | $481,647 +3% |
| 2022 | $6,299 -0.5% | $467,618 +3% |
| 2021 | $6,331 +0.6% | $453,998 +1.4% |
| 2020 | $6,294 +1.9% | $447,730 -28.4% |
| 2019 | $6,176 | $625,009 +45.5% |
| 2018 | $6,176 +0% | $429,503 +2.1% |
| 2017 | $6,176 +0.1% | $420,669 -31.9% |
| 2016 | $6,171 +0.5% | $618,065 +1.3% |
| 2015 | $6,139 -1.7% | $610,293 +4.9% |
| 2014 | $6,247 0% | $581,801 +12.1% |
| 2013 | $6,250 +1.7% | $518,783 +31.9% |
| 2012 | $6,146 -1.1% | $393,222 -17.3% |
| 2011 | $6,214 -1% | $475,303 +2.5% |
| 2010 | $6,275 +11.8% | $463,902 -10.8% |
| 2009 | $5,611 +5.4% | $520,110 +4.8% |
| 2008 | $5,322 -0.9% | $496,290 -10.2% |
| 2007 | $5,370 -2.7% | $552,600 +6.7% |
| 2006 | $5,519 -5.1% | $518,100 -7.9% |
| 2004 | $5,816 +1.6% | $562,440 +42.5% |
| 2003 | $5,723 +0.6% | $394,710 +14.6% |
| 2002 | $5,691 | $344,340 +10.7% |
| 2000 | -- | $311,050 |
Find assessor info on the county website
Monthly payment
Climate risks
Neighborhood: 33957
Similar homes
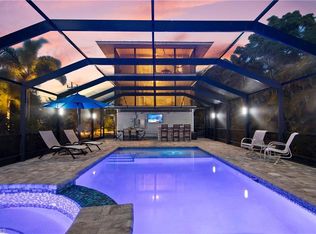
- $799,0003 bd2 ba1.8k sqft1083 S Yachtsman Dr, Sanibel, FL 33957For Sale
 MLS ID #2260842, Bryan Hall, Pfeifer Realty Group LLC. Sanibel And Captiva Island AOR
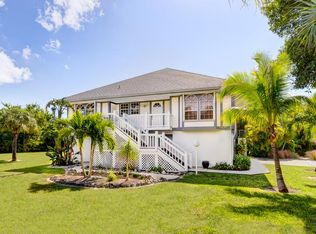
- $949,0003 bd2 ba2k sqft1009 Dixie Beach Blvd, Sanibel, FL 33957For Sale
 MLS ID #2260828, Susan D Ives, Premier Sotheby's Int'l Realty. Sanibel And Captiva Island AOR
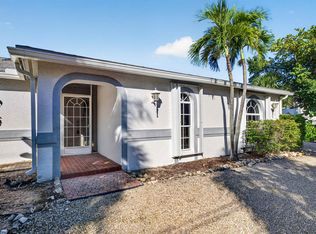
- $949,0003 bd2 ba1.6k sqft1112 Skiff Pl, Sanibel, FL 33957For Sale
 MLS ID #2260805, Eric J Pfeifer, Pfeifer Realty Group LLC. Sanibel And Captiva Island AOR
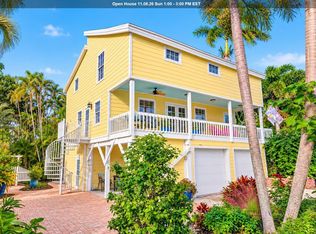
- $930,0004 bd3 ba2k sqft657 Cardium St, Sanibel, FL 33957For Sale
 MLS ID #2260786, Wendy K Kirschner, Pfeifer Realty Group LLC. Sanibel And Captiva Island AOR
- $897,5003 bd2 ba1.8k sqft750 Marthas Ln, Sanibel, FL 33957For SaleMLS ID #2260834, Kristine Cardinale, P.A., John R. Wood Properties. Sanibel And Captiva Island AOR
- $849,0003 bd2 ba1.6k sqft640 Oliva St, Sanibel, FL 33957For SaleMLS ID #2260802, Mary Bondurant, Kingfisher Real Estate Inc.. Sanibel And Captiva Island AOR
- $975,0003 bd2 ba2k sqft1417 Causey Ct, Sanibel, FL 33957For SaleMLS ID #2260813, Sarah Ashton, KW Florida Living. Sanibel And Captiva Island AOR
- $790,0003 bd3 ba2.1k sqft1167 Sand Castle Rd, Sanibel, FL 33957For SaleMLS ID #2260128, C Paul Primeaux, McCallion and McCallion. Sanibel And Captiva Island AOR
- $976,0004 bd2 ba2.1k sqft1300 Par View Dr, Sanibel, FL 33957For SaleMLS ID #2260769, Cindy H Sitton, Royal Shell Real Estate, Inc.. Sanibel And Captiva Island AOR
- $875,0003 bd2 ba2.3k sqft9436 Yucca Ct, Sanibel, FL 33957For SaleMLS ID #2260746, Kerri Maw, Pfeifer Realty Group LLC. Sanibel And Captiva Island AOR
- $789,0004 bd2 ba1.4k sqft1012/1014 E Gulf Dr, Sanibel, FL 33957For SaleMLS ID #2260824, Michael J Laperuta, Blue Echo Realty Group. Sanibel And Captiva Island AOR
- $750,0002 bd2 ba2.2k sqft200 Periwinkle WAY #233, SANIBEL, FL 33957For Sale
 MLS ID #226039200, Justin O'Hara, Premiere Plus Realty Company. SWFLMLS
- $885,0003 bd2 ba1.6k sqft1225 Junonia St, Sanibel, FL 33957For SaleMLS ID #2260568, Brian B Murty, Royal Shell Real Estate, Inc.. Sanibel And Captiva Island AOR
- $1,095,0003 bd2 ba2.2k sqft1057 Sand Castle Rd, Sanibel, FL 33957For SaleMLS ID #2260780, Kelly Huguenin, Pfeifer Realty Group LLC. Sanibel And Captiva Island AOR
- $839,0003 bd2 ba1.5k sqft1410 Sand Castle Rd, Sanibel, FL 33957For SaleMLS ID #2260419, Chip C Wolfe, RE/MAX REALTY GROUP. Sanibel And Captiva Island AOR
- $895,0004 bd2 ba1.5k sqft754/756 Donax St, Sanibel, FL 33957For SaleMLS ID #2260766, Teresa T Baker, Pfeifer Realty Group LLC. Sanibel And Captiva Island AOR
- $699,0005 bd3 ba1.9k sqft1113 Skiff Pl, Sanibel, FL 33957For SaleMLS ID #2230979, Jennifer McSorley, Pfeifer Realty Group LLC. Sanibel And Captiva Island AOR
- $899,0004 bd3 ba1.6k sqft240 Southwinds Dr, Sanibel, FL 33957For SaleMLS ID #2260339, Andre Arensman, John R. Wood Properties. Sanibel And Captiva Island AOR
- $837,0003 bd3 ba1.7k sqft996 Greenwood Ct N, Sanibel, FL 33957For SaleMLS ID #2260807, Kerri Maw, Pfeifer Realty Group LLC. Sanibel And Captiva Island AOR
- $849,9004 bd2 ba2.5k sqft2805 8th Ave, Saint James City, FL 33956For Sale
 MLS ID #2026046528, Neill Fries, Castaways Island Realty LLC. Florida Gulf Coast MLS
