Under contract
$499,000
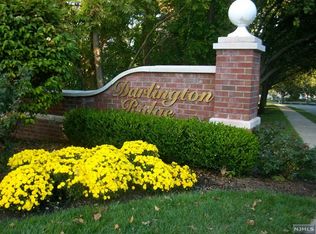
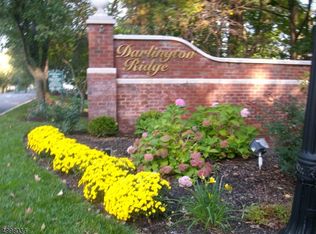
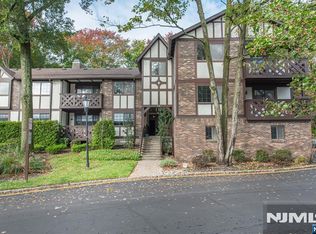
1147 Sycamore Lane, Mahwah, NJ 07430
2beds
--sqft
Condominium
Built in ----
-- sqft lot
$-- Zestimate®
$--/sqft
$408/mo HOA
What's special
- 19 days
- 833
- 63
Likely to sell faster than
Zillow last checked:
Listing updated:
Listed by:
Paraskeve Eleftheriou 973-220-4578,
Anton Group Real Estate
Source: NJMLS,MLS#: 26038773
Facts & features
Interior
Bedrooms & bathrooms
- Bedrooms: 2
- Bathrooms: 2
- Full bathrooms: 2
Cooling
- Has cooling: Yes
Features
- One Floor Living
- Basement: None
Property
Parking
- Total spaces: 1
Features
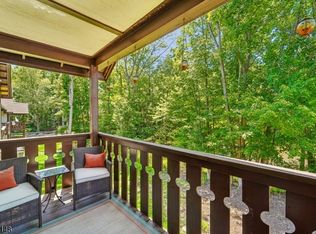
- Patio & porch: Terrace
- Waterfront features: None
Details
- Parcel number: 3300139000001147
Construction
Type & style
- Home type: Condo
- Property subtype: Condominium
Community & HOA
Community
- Features: Close/Shopg, Close/Trans, Common Area, Pool Outdoor, Tennis Ct
HOA
- HOA fee: $408 monthly
Location
- Region: Mahwah
Financial & listing details
- Tax assessed value: $279,400
- Annual tax amount: $5,943
- Date on market: 10/11/2026
- Listing agreement: Exclusive Right To Sell
- Ownership: Private
Estimated market value
Not available
Estimated sales range
Not available
Not available
Price history
| Date | Event | Price |
|---|---|---|
| 10/18/2026 | Pending sale | $499,000 |
Source:  NJMLS #26038773 Report a problem | ||
| 10/11/2026 | Listed for sale | $499,000+33.1% |
Source: NJMLS #26038773 Report a problem | ||
| 1/31/2023 | Sold | $375,000+4.2% |
Source: NJMLS #22028347 Report a problem | ||
| 11/22/2022 | Pending sale | $359,900 |
Source: NJMLS #22028347 Report a problem | ||
| 11/4/2022 | Listed for sale | $359,900 |
Source: NJMLS #22028347 Report a problem | ||
| 9/13/2022 | Listing removed | $359,900 |
Source: NJMLS #22028347 Report a problem | ||
| 9/13/2022 | Listed for sale | $359,900 |
Source: NJMLS #22028347 Report a problem | ||
| 8/23/2022 | Pending sale | $359,900 |
Source: NJMLS #22028347 Report a problem | ||
| 7/29/2022 | Listed for sale | $359,900 |
Source: NJMLS #22028347 Report a problem | ||
Public tax history
| Year | Property taxes | Tax assessment |
|---|---|---|
| 2026 | $5,943 +3.1% | $279,400 |
| 2025 | $5,767 | $279,400 |
| 2024 | $5,767 +1.3% | $279,400 |
| 2023 | $5,691 +3.3% | $279,400 |
| 2022 | $5,510 +1.1% | $279,400 |
| 2021 | $5,451 +6% | $279,400 |
| 2020 | $5,144 +1.4% | $279,400 |
| 2019 | $5,071 | $279,400 |
| 2018 | $5,071 +5.4% | $279,400 +1.5% |
| 2017 | $4,811 +1.4% | $275,400 |
| 2016 | $4,745 +1.7% | $275,400 |
| 2015 | $4,665 +1.8% | $275,400 |
| 2014 | $4,583 +5.3% | $275,400 |
| 2012 | $4,351 +8.7% | $275,400 |
| 2011 | $4,004 +3% | $275,400 +46.1% |
| 2010 | $3,889 +4.4% | $188,500 |
| 2009 | $3,725 | $188,500 |
| 2007 | -- | $188,500 |
| 2006 | -- | $188,500 |
| 2005 | -- | $188,500 |
| 2004 | -- | $188,500 |
| 2003 | -- | $188,500 |
| 2002 | -- | $188,500 |
| 2001 | -- | $188,500 |
Find assessor info on the county website
Monthly payment
Est. payment
Payment breakdown
Explore the cost of this home by adjusting the details. Changes won't be saved.Climate risks
Neighborhood: 07430
Similar homes
- $499,9002 bd2 ba-- sqft1102 Faulkner Court, Mahwah, NJ 07430For Sale
 MLS ID #26039898, Ryan Sunden, Your Home Sold Guaranteed Realty-The Sunden Group. NJMLS
- $489,0002 bd2 ba-- sqft2089 Edward Court, Mahwah, NJ 07430For Sale
 MLS ID #26040819, Gary Silberstein, Keller Williams Valley Realty. NJMLS
- $559,0002 bd2 ba1.2k sqft3811 Melville Ct, Mahwah Twp., NJ 07430For Sale
 MLS ID #4060217, Roseann Thompson, The Agency One Rock. GSMLS
- $475,0002 bd2 ba1.1k sqft996 Boxwood Ct, Mahwah, NJ 07430For Sale By Owner

- $519,0002 bd3 ba-- sqft2181 Kent Court, Mahwah, NJ 07430For SaleMLS ID #26040888, Jodi Anton, Coldwell Banker, Hillsdale. NJMLS
- $599,0002 bd1 ba-- sqft14 Parsons Court, Mahwah, NJ 07430For SaleMLS ID #26039800, Tony Nabhan, Keller Williams City Views Realty. NJMLS
- $434,9002 bd1 ba-- sqft643 Plum Terrace, Mahwah, NJ 07430For SaleMLS ID #26018167, Keith Lawrence, The Agency One Rock-Mahwah. NJMLS
- $480,0002 bd2 ba-- sqft1293 Paddington Road #A2, Mahwah, NJ 07430For SaleMLS ID #26033287, Mark Dari, Howard Hanna Rand Realty, Old Tappan. NJMLS
- $389,0002 bd1 ba-- sqft1104 Sage Court, Mahwah, NJ 07430For SaleMLS ID #26036332, Patricia Novak, Berkshire Hathaway Home Services Horizon Realty. NJMLS
- $419,0002 bd1 ba-- sqft2902 Mark Twain Way, Mahwah, NJ 07430For SaleMLS ID #26034574, Yvonne Mayo, Keller Williams Village Square Realty. NJMLS
- $334,9002 bd1 ba-- sqft1419 Faulkner Court, Mahwah, NJ 07430For SaleMLS ID #26039472, Elina Policastro, Prominent Properties Sotheby's International Realty-Edgewater. NJMLS
- $480,0003 bd3 ba1.6k sqft441 Genesee Court, Suffern, NY 10901For Sale
 MLS ID #1006744, Debra S Gay, Listing by: Coldwell Banker Realty. OneKey® MLS as distributed by MLS GRID
- $359,0003 bd1 ba-- sqft1409 Faulkner Court, Mahwah, NJ 07430For SaleMLS ID #26036653, Davide Berardi, JMichaels Realty LLC. NJMLS
- $575,0003 bd2 ba-- sqft23 Wanamaker Avenue, Mahwah, NJ 07430For SaleMLS ID #26039958, Mikaela Arpino, NJ Real Estate Boutique, LLC. NJMLS
