Home is half gutted, making initial renovations easier. Half the lathe and plaster are removed and numerous soiled carpets. Kitchens/baths still need demo and remaining lathe-plaster on the balloon frame structure. Will be a total rehab needing a new roof, windows, doors, insulation, drywall, electrical/plumbing (all gutted and old tube style when it was installed).
There is potential to build an auxiliary apartment in spacious attic with fire escape landing built on back-side of duplex for second and third floors to meet fire code and increase rental revenue. Est $3-$4.5K rent after rehab.
For sale by owner
$89,000
116-118 Gallup St, North Adams, MA 01247
4beds
2,528sqft
MultiFamily
Built in 1900
-- sqft lot
$-- Zestimate®
$35/sqft
$-- HOA
Overview
- 34 days
- 1,119
- 47
Listed by:
Property Owner (231) 818-2880
Facts & features
Interior
Bedrooms & bathrooms
- Bedrooms: 4
- Bathrooms: 2
- Full bathrooms: 2
Heating
- Oil
Features
- Basement: Partially finished
Interior area
- Total interior livable area: 2,528 sqft
Property
Features
- Exterior features: Wood
Lot
- Size: 3,049 Square Feet
Details
- Parcel number: NADAM124B0000L149
Construction
Type & style
- Home type: MultiFamily
Materials
- Frame
- Roof: Slate
Condition
- New construction: No
- Year built: 1900
Community & HOA
Location
- Region: North Adams
Financial & listing details
- Price per square foot: $35/sqft
- Tax assessed value: $115,000
- Annual tax amount: $1,922
- Date on market: 10/13/2026
Estimated market value
Not available
Estimated sales range
Not available
$1,909/mo
Price history
| Date | Event | Price |
|---|---|---|
| 10/13/2026 | Listed for sale | $89,000+673.9%$35/sqft |
Source: Owner Report a problem | ||
| 7/31/2015 | Sold | $11,500-54%$5/sqft |
Source:  BCMLS #211065 Report a problem | ||
| 7/21/2014 | Sold | $25,000$10/sqft |
Source: Public Record Report a problem | ||
Public tax history
| Year | Property taxes | Tax assessment |
|---|---|---|
| 2025 | $1,922 +6.6% | $115,000 +9.3% |
| 2024 | $1,803 +7.2% | $105,200 +10.5% |
| 2023 | $1,682 -31.4% | $95,200 -28.1% |
| 2022 | $2,453 +7.6% | $132,400 +8.1% |
| 2021 | $2,280 +3.4% | $122,500 +3.4% |
| 2020 | $2,206 -0.1% | $118,500 +2.5% |
| 2019 | $2,209 +17.7% | $115,600 +13.2% |
| 2018 | $1,877 +5.1% | $102,100 +1% |
| 2017 | $1,786 +1.5% | $101,100 -0.1% |
| 2016 | $1,760 -11.1% | $101,200 -14.7% |
| 2015 | $1,979 +4.8% | $118,600 |
| 2014 | $1,888 +4% | $118,600 |
| 2013 | $1,815 +3.2% | $118,600 |
| 2012 | $1,758 +5.9% | $118,600 |
| 2011 | $1,660 +8.9% | $118,600 -3.3% |
| 2010 | $1,525 +7.7% | $122,600 +1.4% |
| 2009 | $1,416 +3.4% | $120,900 |
| 2008 | $1,369 +26.1% | $120,900 +23.9% |
| 2007 | $1,086 -1% | $97,600 +3% |
| 2006 | $1,097 +11.8% | $94,800 +18.1% |
| 2005 | $981 +1.9% | $80,300 +10.8% |
| 2004 | $963 +10.7% | $72,500 +22.5% |
| 2003 | $870 +2.6% | $59,200 |
| 2002 | $848 -5.7% | $59,200 +3% |
| 2000 | $899 | $57,500 |
Find assessor info on the county website
Monthly payment
Est. payment
Payment breakdown
Explore the cost of this home by adjusting the details. Changes won't be saved.Climate risks
Neighborhood: 01247
Similar homes
- $70,0006 bd2 ba2.2k sqft14-18 Loftus St #0, North Adams, MA 01247For Sale
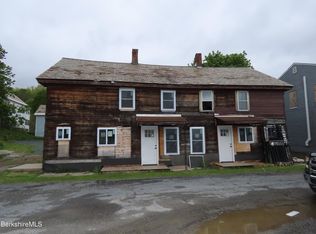 MLS ID #249639, Dennis J D'Arcangelo, MONARCH REALTY, INC.. BCMLS
- $124,9006 bd2 ba2.1k sqft516 Union St #518, North Adams, MA 01247For Sale
 MLS ID #73571485, Benjamin Hause, Keller Williams Realty North Central. MLS PIN
- $89,0003 bd2 ba1.7k sqft314 VT Route 112, Whitingham, VT 05361Active
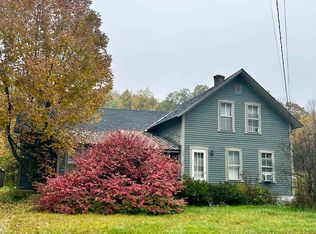 MLS ID #5116450, Kristen Breeden. PrimeMLS
- $49,9004 bd2 ba2.2k sqft477 Mohawk Trl, Drury, MA 01343For Sale
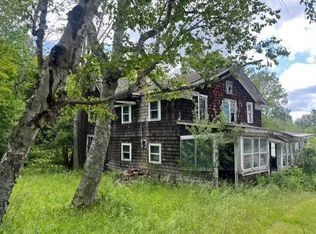 MLS ID #73396427, Laiken Rapisarda, Lamacchia Realty, Inc.. MLS PIN
- $118,0002 bd1 ba1.2k sqft72 Willow Way, Stephentown, NY 12169Active
 MLS ID #20265168, Jolene Morris, Listing by: Howard Hanna Capital, Inc.. HVCRMLS
