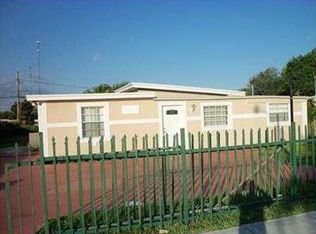
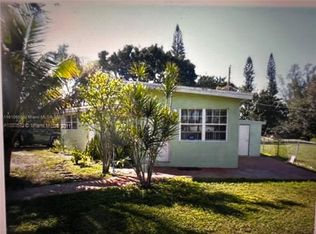
This is a 926 square foot, 2 bedroom, single family home. This home is located at 116 Miami Gardens Rd, West Park, FL 33023.
Pre-foreclosure
Est. $400,200
116 Miami Gardens Rd, West Park, FL 33023
2beds
--baths
926sqft
SingleFamily
Built in 1952
10,332 Square Feet Lot
$400,200 Zestimate®
$432/sqft
$-- HOA
Overview
- 62 days |
- 8 |
- 0 |
Facts & features
Interior
Bedrooms & bathrooms
- Bedrooms: 2
Features
- Flooring: Tile
Interior area
- Total interior livable area: 926 sqft
Property
Features
- Exterior features: Stucco, Cement / Concrete
Lot
- Size: 10,332 Square Feet
Details
- Parcel number: 514125080620
Construction
Type & style
- Home type: SingleFamily
Materials
- masonry
- Foundation: Other
- Roof: Composition
Condition
- Year built: 1952
Community & HOA
Location
- Region: West Park
Financial & listing details
- Price per square foot: $432/sqft
- Tax assessed value: $331,130
- Annual tax amount: $4,096
Visit our professional directory to find a foreclosure specialist in your area that can help with your home search.
Find a foreclosure agentForeclosure details
Estimated market value
$400,200
$360,000 - $436,000
$2,514/mo
Price history
| Date | Event | Price |
|---|---|---|
| 11/8/2004 | Sold | $96,000+135.4%$104/sqft |
Source: Public Record Report a problem | ||
| 9/1/1987 | Sold | $40,779$44/sqft |
Source: Public Record Report a problem | ||
Public tax history
| Year | Property taxes | Tax assessment |
|---|---|---|
| 2025 | $4,096 +4.5% | $151,260 +7.8% |
| 2024 | $3,920 +6.9% | $140,310 +7.7% |
| 2023 | $3,668 +11.4% | $130,230 +7.6% |
| 2022 | $3,293 +14.5% | $120,990 +11% |
| 2021 | $2,876 -0.1% | $109,000 +6.9% |
| 2020 | $2,880 +3.4% | $102,010 +7.1% |
| 2019 | $2,785 | $95,290 -26.6% |
| 2018 | $2,785 +10.1% | $129,850 +55.2% |
| 2017 | $2,530 +10.6% | $83,660 +6.5% |
| 2016 | $2,288 +11.7% | $78,520 +5.7% |
| 2015 | $2,049 +11% | $74,260 +5.6% |
| 2014 | $1,846 | $70,340 +5.7% |
| 2013 | $1,846 +5.2% | $66,520 |
| 2012 | $1,755 -8.5% | $66,520 -11.1% |
| 2011 | $1,919 -12.9% | $74,820 -14.9% |
| 2010 | $2,204 -22% | $87,900 -33.5% |
| 2009 | $2,827 -25.4% | $132,230 -30% |
| 2008 | $3,792 -19.9% | $188,890 -11.2% |
| 2007 | $4,736 +11.8% | $212,770 +29.4% |
| 2006 | $4,237 | $164,440 +46% |
| 2005 | -- | $112,600 +92.8% |
| 2004 | $1,295 -0.2% | $58,400 +1.9% |
| 2003 | $1,298 +0.7% | $57,320 +2.4% |
| 2002 | $1,288 +1.7% | $55,980 +1.6% |
| 2001 | $1,267 +5.5% | $55,100 |
| 2000 | $1,201 | -- |
Find assessor info on the county website
Monthly payment
Estimated monthly payment$1,822
All calculations are estimates and provided by Zillow, Inc. for informational purposes only. Actual amounts may vary.
HOA fees may include property taxes on listings classified as Co-Ops. Contact the listing agent and/or owner for fee details.
Mortgage interest rates are dependent on a number of factors, including credit score, down payment, and repayment length. Interest rate data provided by Zillow Group Marketplace, Inc. as of 1/1/1970 from various mortgage lenders with which we have lead or other similar arrangements; the Estimated Payment is an average of those rates.
See how much you could borrow to make a competitive offer.
Climate risks
Neighborhood: 33023
Nearby schools
GreatSchools rating
- 5/10Watkins Elementary SchoolGrades: PK-5Distance: 0.3 mi
- 3/10McNicol Middle SchoolGrades: 6-8Distance: 2.7 mi
- 2/10Hallandale High SchoolGrades: 9-12Distance: 2.6 mi


- Florida
- Broward County
- West Park
- 33023
- 116 Miami Gardens Rd
Nearby cities
Nearby zip codes
Other West Park Topics
