Amazing floor plan. Every room works perfectly with no wasted space. Remodeled with new vanities, granite throughout. Extra custom cabinets in kitchen and master bath with laundry shoot. All baths have beautiful custom multi colored slate tile. Laundry room with sink and extra storage. Large yard and cement pads in back yard. Side gate that opens for parking an RV or 3rd vehicle. Deck with benches, shaded front yard, with 5 garden bed areas.
Pre-foreclosure
Street View
Est. $370,800
1205 W Capernaum Rd, West Jordan, UT 84088
4beds
2,000sqft
SingleFamily
Built in 1986
10,018 Square Feet Lot
$370,800 Zestimate®
$185/sqft
$-- HOA
Overview
- 31 days
- 97
- 6
Facts & features
Interior
Bedrooms & bathrooms
- Bedrooms: 4
- Bathrooms: 3
- Full bathrooms: 2
- 1/2 bathrooms: 1
Heating
- Other
Cooling
- Central
Appliances
- Included: Dishwasher, Dryer, Freezer, Garbage disposal, Microwave, Range / Oven, Refrigerator, Washer
Features
- Flooring: Tile, Carpet, Slate
- Basement: Finished
- Has fireplace: Yes
Interior area
- Total interior livable area: 2,000 sqft
Property
Parking
- Parking features: Garage - Attached, On-street
Features
- Exterior features: Other, Vinyl, Brick, Metal
- Has view: Yes
- View description: Mountain
Lot
- Size: 10,018 Square Feet
Details
- Parcel number: 27021530030000
Construction
Type & style
- Home type: SingleFamily
Materials
- Other
- Roof: Asphalt
Condition
- Year built: 1986
Community & HOA
Location
- Region: West Jordan
Financial & listing details
- Price per square foot: $185/sqft
- Tax assessed value: $520,600
- Annual tax amount: $2,578
Foreclosure details
Estimated market value
$370,800
$352,000 - $389,000
$2,452/mo
Price history
| Date | Event | Price |
|---|---|---|
| 10/6/2026 | Listing removed | $365,000$183/sqft |
Source:  UtahRealEstate.com #2188075 Report a problem | ||
| 10/1/2026 | Listed for sale | $365,000-25.5%$183/sqft |
Source: UtahRealEstate.com #2188075 Report a problem | ||
| 11/4/2021 | Listing removed | -- |
Source: UtahRealEstate.com #1760497 Report a problem | ||
| 10/8/2021 | Pending sale | $489,900$245/sqft |
Source: UtahRealEstate.com #1760497 Report a problem | ||
| 10/1/2021 | Price change | $489,900-1.2%$245/sqft |
Source: UtahRealEstate.com #1760497 Report a problem | ||
| 9/21/2021 | Price change | $495,900-0.8%$248/sqft |
Source: UtahRealEstate.com #1760497 Report a problem | ||
| 8/29/2021 | Price change | $499,900-2%$250/sqft |
Source: UtahRealEstate.com #1760497 Report a problem | ||
| 8/27/2021 | Price change | $509,900-1%$255/sqft |
Source: UtahRealEstate.com #1760497 Report a problem | ||
| 8/23/2021 | Price change | $514,900+1%$257/sqft |
Source: UtahRealEstate.com #1760497 Report a problem | ||
| 8/22/2021 | Price change | $509,900-1%$255/sqft |
Source: UtahRealEstate.com #1760497 Report a problem | ||
| 8/12/2021 | Price change | $514,900+3%$257/sqft |
Source: UtahRealEstate.com #1760497 Report a problem | ||
| 8/6/2021 | Listed for sale | $499,900$250/sqft |
Source: UtahRealEstate.com #1760497 Report a problem | ||
Public tax history
| Year | Property taxes | Tax assessment |
|---|---|---|
| 2025 | $2,578 -1.9% | $286,330 +2.9% |
| 2024 | $2,628 -2.4% | $278,135 +3.6% |
| 2023 | $2,693 -2.3% | $268,565 -0.7% |
| 2022 | $2,756 | $270,435 +45.7% |
| 2021 | -- | $185,570 +11.5% |
| 2020 | $1,986 +0.9% | $166,485 +2.9% |
| 2019 | $1,969 +6.6% | $161,810 +7.9% |
| 2018 | $1,847 +0.4% | $149,930 -42.3% |
| 2017 | $1,839 +4.5% | $259,800 +13.2% |
| 2016 | $1,760 +6.3% | $229,600 +1.4% |
| 2015 | $1,656 -1.2% | $226,500 +6% |
| 2014 | $1,675 | $213,700 +7.4% |
| 2013 | -- | $199,000 +3.4% |
| 2012 | -- | $192,500 -6.9% |
| 2011 | -- | $206,700 -3.5% |
| 2010 | -- | $214,100 -1.1% |
| 2009 | -- | $216,500 -9.2% |
| 2008 | $1,453 | $238,400 +0.8% |
| 2007 | -- | $236,500 +19.9% |
| 2006 | -- | $197,200 +9.6% |
| 2005 | -- | $180,000 +14.9% |
| 2002 | -- | $156,700 +4.8% |
| 2001 | -- | $149,500 +1.9% |
| 2000 | -- | $146,700 |
Find assessor info on the county website
Monthly payment
Climate risks
Neighborhood: 84088
- $559,1004 bd3 ba1.9k sqft1217 W Capernaum Rd, West Jordan, UT 84088Off Market
- $547,0004 bd3 ba2k sqft8888 S Galilee Way, West Jordan, UT 84088Off Market

- $532,1005 bd2 ba1.1k sqft1214 W Galilee Cir, West Jordan, UT 84088Off Market
- $585,5003 bd3 ba2k sqft1210 W Galilee Cir, West Jordan, UT 84088Off Market

Similar homes
- $495,0004 bd3 ba2.3k sqft1384 W Countrywood Ln, West Jordan, UT 84088For Sale
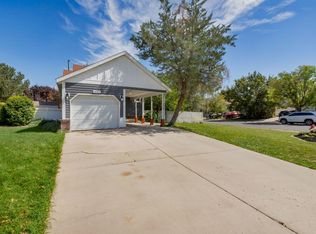
 MLS ID #2185307, Joseph Ellis, Flat Rate Homes. UtahRealEstate.com
- $459,9003 bd3 ba1.6k sqft8479 S 3155 W, West Jordan, UT 84088For Sale
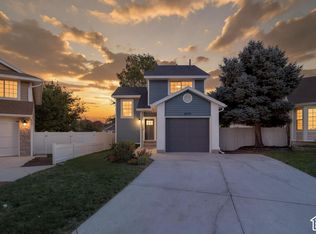 MLS ID #2194917, Brittany Kershner, Christie's International Real Estate VUE (Christies VUE Salt Lake). UtahRealEstate.com
- $550,0004 bd3 ba2.4k sqft2372 W Pauline Way S, West Jordan, UT 84088For Sale
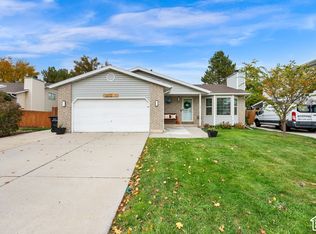 MLS ID #2194450, Craig R Hawker, Action Team Realty. UtahRealEstate.com
- $499,9003 bd2 ba2.6k sqft1059 W Buckskin Ln N, West Jordan, UT 84088For Sale
 MLS ID #2188793, Kenneth Sperry, Presidio Real Estate. UtahRealEstate.com
- $544,9004 bd2 ba1.6k sqft9170 S River Ridge Dr, West Jordan, UT 84088For SaleMLS ID #2187650, Stuart M Young, SweetUtahHomes.com, LLC. UtahRealEstate.com
- $549,9005 bd4 ba2.8k sqft8843 S Capernaum Rd, West Jordan, UT 84088For SaleMLS ID #2107550, Scott Allen, ALLEN & ASSOCIATES. UtahRealEstate.com
- $419,9003 bd3 ba1.7k sqft1407 W Stone Meadow Dr, West Jordan, UT 84088For SaleMLS ID #2181004, Kaden Hayes, Wiser Real Estate, LLC. UtahRealEstate.com
- $479,9004 bd3 ba2.3k sqft8688 S Diamond Dove Dr, West Jordan, UT 84088For SaleMLS ID #2172690, Brooke D'Sousa, Real Broker, LLC (Canyons Luxury Real Estate). UtahRealEstate.com
- $359,9003 bd1 ba1k sqft596 W 5th Ave, Midvale, UT 84047For SaleMLS ID #2194839, Justine Martinez, Presidio Real Estate (South Valley). UtahRealEstate.com
- $449,9004 bd2 ba1.8k sqft651 W Gardenia Dr, Midvale, UT 84047For SaleMLS ID #2194639, Stacee Riekhof, Realtypath LLC (Prestige). UtahRealEstate.com
- $330,0002 bd2 ba1.1k sqft1466 W Twin Oaks Dr S, West Jordan, UT 84088For SaleMLS ID #2186983, Maria Florencia Barrera, Real Broker, LLC. UtahRealEstate.com
- $550,0004 bd2 ba1.6k sqft9353 S Windflower Ln W, Sandy, UT 84070For SaleMLS ID #2195174, Lori C Jackson, Equity Real Estate (Advantage). UtahRealEstate.com
- $410,0003 bd2 ba1.7k sqft1542 W Crystal Ridge Dr S, West Jordan, UT 84084For SaleMLS ID #2171670, Manuel A Rodriguez Alvarenga, Realtypath LLC (Utah). UtahRealEstate.com
- $410,0002 bd3 ba1.5k sqft1412 W Stone Meadow Dr, West Jordan, UT 84088For SaleMLS ID #2163791, Lori S Layton, Chapman-Richards & Associates, Inc.. UtahRealEstate.com
- $435,0005 bd2 ba1.5k sqft7690 S 1530 W, West Jordan, UT 84084For SaleMLS ID #2183739, Casey Hansen, Windermere Real Estate (Daybreak). UtahRealEstate.com
- $425,0004 bd2 ba2.7k sqft8363 S Jackson St W, Midvale, UT 84047For SaleMLS ID #2192239, Michael De Rosa, Mountain Land Realty North Salt Lake Inc. UtahRealEstate.com
- $450,0004 bd2 ba1.9k sqft3139 W 8525 S, West Jordan, UT 84088For SaleMLS ID #2166521, Travis Stokes, Stokes & Company Real Estate Services. UtahRealEstate.com
- $450,0005 bd2 ba2k sqft7684 S 2250 W, West Jordan, UT 84084For SaleMLS ID #2185939, Darin Thomas, Real Broker, LLC. UtahRealEstate.com
- $454,9004 bd2 ba1.8k sqft7208 S Christalee Ct, West Jordan, UT 84084For SaleMLS ID #2190549, Karina Bassett, Fathom Realty (Union Park). UtahRealEstate.com
