Perfect starter home or investment property!
For sale
$153,000
1211 N Apache St, Amarillo, TX 79107
3beds
1,336sqft
Single Family Residence
Built in 1961
-- sqft lot
$150,400 Zestimate®
$115/sqft
$-- HOA
What's special
- 1 day
- 32
- 0
Likely to sell faster than
Zillow last checked:
Listing updated:
Listed by:
Zoey Shepherd 806-443-5441,
Keller Williams Realty Amarillo
Source: AMMLS,MLS#: 26-8282
Facts & features
Interior
Bedrooms & bathrooms
- Bedrooms: 3
- Bathrooms: 1
- Full bathrooms: 1
Heating
- Central
Cooling
- Central Air
Interior area
- Total structure area: 1,336
- Total interior livable area: 1,336 sqft
Property
Parking
- Total spaces: 1
- Parking features: Garage - Attached
- Attached garage spaces: 1
Details
- Parcel number: 146968
- Zoning description: 0300 - NE Amarillo in City Limits
Construction
Type & style
- Home type: SingleFamily
- Property subtype: Single Family Residence
Condition
- New construction: No
- Year built: 1961
Utilities & green energy
- Sewer: Public Sewer
- Water: City
Community & HOA
HOA
- Has HOA: No
Location
- Region: Amarillo
Financial & listing details
- Price per square foot: $115/sqft
- Tax assessed value: $154,541
- Date on market: 10/20/2026
Estimated market value
$150,400
$143,000 - $158,000
$1,461/mo
Price history
| Date | Event | Price |
|---|---|---|
| 10/20/2026 | Listed for sale | $153,000+10.9%$115/sqft |
Source:  AMMLS #26-8282 Report a problem | ||
| 3/21/2026 | Listing removed | $138,000$103/sqft |
Source: AMMLS #25-7951 Report a problem | ||
| 9/12/2025 | Listed for sale | $138,000$103/sqft |
Source: AMMLS #25-7951 Report a problem | ||
| 8/22/2025 | Listing removed | $138,000$103/sqft |
Source: AMMLS #24-7153 Report a problem | ||
| 4/11/2025 | Price change | $138,000-0.7%$103/sqft |
Source: AMMLS #24-7153 Report a problem | ||
| 4/8/2025 | Price change | $139,000-0.7%$104/sqft |
Source: AMMLS #24-7153 Report a problem | ||
| 2/17/2025 | Price change | $140,000-1.8%$105/sqft |
Source: AMMLS #24-7153 Report a problem | ||
| 1/28/2025 | Price change | $142,500-1.7%$107/sqft |
Source: AMMLS #24-7153 Report a problem | ||
| 8/21/2024 | Price change | $145,000+61.1%$109/sqft |
Source: AMMLS #24-7153 Report a problem | ||
| 6/18/2024 | Listed for sale | $90,000+24.1%$67/sqft |
Source: Owner Report a problem | ||
| 9/24/2020 | Listing removed | $72,500$54/sqft |
Source: MGroup #20-5057 Report a problem | ||
| 8/24/2020 | Pending sale | $72,500$54/sqft |
Source: MGroup #20-5057 Report a problem | ||
| 8/20/2020 | Listed for sale | $72,500+31.8%$54/sqft |
Source: MGroup #20-5057 Report a problem | ||
| 11/27/2011 | Listing removed | $55,000$41/sqft |
Source: Wes and Margaret Brown Report a problem | ||
| 10/8/2011 | Price change | $55,000-8.2%$41/sqft |
Source: Wes and Margaret Brown Report a problem | ||
| 4/30/2011 | Price change | $59,900-0.2%$45/sqft |
Source: Wes and Margaret Brown Report a problem | ||
| 11/19/2010 | Listed for sale | $60,000$45/sqft |
Source: Lyons Realty #10-62082 Report a problem | ||
Public tax history
| Year | Property taxes | Tax assessment |
|---|---|---|
| 2026 | -- | $143,171 +20% |
| 2025 | $2,529 +22.4% | $119,309 +20% |
| 2024 | $2,067 +15.3% | $99,424 +20% |
| 2023 | $1,793 -38.8% | $82,853 -33% |
| 2022 | $2,930 +35.5% | $123,589 +44.1% |
| 2021 | $2,162 +35.3% | $85,782 +2.3% |
| 2020 | $1,597 +11.5% | $83,873 +8.1% |
| 2019 | $1,433 +13.1% | $77,613 +10.4% |
| 2018 | $1,267 +15.6% | $70,277 -1.1% |
| 2017 | $1,096 +14.2% | $71,044 +50.5% |
| 2016 | $960 -98.8% | $47,216 |
| 2015 | $77,362 +4979.5% | $47,216 -26.1% |
| 2014 | $1,523 | $63,895 -1.3% |
| 2013 | -- | $64,738 |
| 2012 | -- | $64,738 |
| 2011 | -- | $64,738 |
| 2010 | -- | $64,738 -6.2% |
| 2009 | -- | $68,998 |
| 2008 | -- | -- |
| 2007 | -- | -- |
| 2006 | -- | -- |
| 2005 | -- | -- |
| 2004 | -- | -- |
| 2003 | -- | -- |
| 2002 | -- | $57,695 +20.5% |
| 2001 | -- | $47,884 |
Find assessor info on the county website
Monthly payment
Est. payment
Payment breakdown
Explore the cost of this home by adjusting the details. Changes won't be saved.Climate risks
Neighborhood: 79107

Similar homes
- $137,0003 bd2 ba1.2k sqft3300 NE 20th Ave, Amarillo, TX 79107For Sale
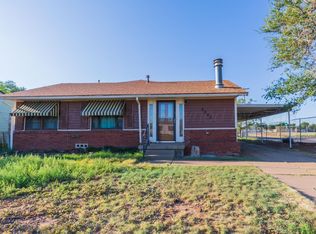
 MLS ID #26-7111, Sabre L. Cofer, EXP Realty, LLC. AMMLS
- $152,5003 bd2 ba1.1k sqft1412 N Roosevelt St, Amarillo, TX 79107For Sale
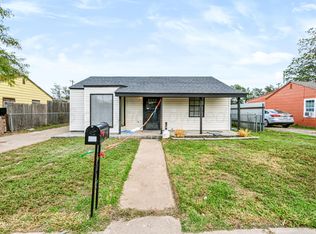 MLS ID #26-4191, Paula Alcocer, Keller Williams Realty Amarillo. AMMLS
- $165,0004 bd1 ba1.3k sqft2903 S Seminole St, Amarillo, TX 79103For Sale
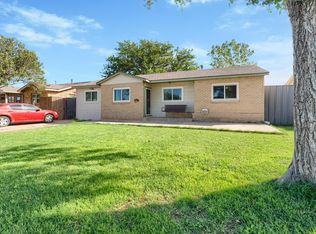 MLS ID #26-8265, Ayvrie Dixon, Green Door Group, LLC. AMMLS
- $155,0003 bd2 ba1.2k sqft1610 N Arapahoe St, Amarillo, TX 79107For Sale
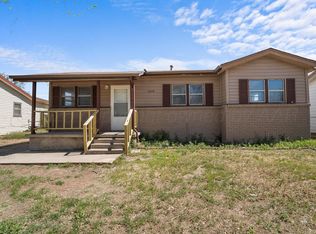 MLS ID #25-8351, Lori Horner Realty Group, Lori Horner Realty Group. AMMLS
- $139,0003 bd1 ba1.2k sqft2408 N Spring St, Amarillo, TX 79107For SaleMLS ID #26-7947, Angel Nunez, Keller Williams Realty Amarillo. AMMLS
- $156,5003 bd2 ba1.4k sqft1519 Goldenrod St, Amarillo, TX 79107For SaleMLS ID #26-5239, Alyssa Allison, EXP Realty, LLC. AMMLS
- $134,0003 bd1 ba1k sqft1636 N Nelson St, Amarillo, TX 79107For SaleMLS ID #26-5588, Mike Hegwood, Fathom Realty, LLC. AMMLS
- $165,0003 bd2 ba1.3k sqft3105 Magnolia St, Amarillo, TX 79107For SaleMLS ID #26-7430, Jenna Bennett, Lyons Realty. AMMLS
- $150,0003 bd2 ba1.4k sqft2041 Dahlia St, Amarillo, TX 79107For SaleMLS ID #26-4329, Karina Holguin, Keller Williams Realty Amarillo. AMMLS
- $165,0003 bd2 ba1.1k sqft4808 SE 28th Ave, Amarillo, TX 79103For SaleMLS ID #26-7235, Daron Boland, RockOne Realty, LLC. AMMLS
- $169,0004 bd2 ba1.2k sqft1235 Pecan St, Amarillo, TX 79107For SaleMLS ID #26-6849, Rick D Thomason, Llano Realty, LLC. AMMLS
- $145,0003 bd2 ba1.1k sqft1408 N Lincoln St, Amarillo, TX 79107For SaleMLS ID #26-6093, The Connie Taylor Group, Keller Williams Realty Amarillo. AMMLS
- $155,0002 bd1 ba1.3k sqft1560 Smiley St, Amarillo, TX 79106For SaleMLS ID #26-8246, Josiah Robles, Keller Williams Realty Amarillo. AMMLS
- $175,0003 bd2 ba1.4k sqft3500 Lynette Dr, Amarillo, TX 79109For SaleMLS ID #26-8244, Rheannon Pierce, EXP Realty, LLC. AMMLS
- $159,9003 bd2 ba1.3k sqft1203 Jasmine St, Amarillo, TX 79107For SaleMLS ID #25-9409, Devin Cook, Keller Williams Realty Amarillo. AMMLS
- $150,0003 bd1 ba1.3k sqft1521 Lockney St, Amarillo, TX 79106For SaleMLS ID #26-8210, Brittaney Bailey, Keller Williams Realty Amarillo. AMMLS
- $125,0003 bd1 ba1k sqft1619 N Highland St, Amarillo, TX 79107For SaleMLS ID #26-4562, Dorthy McCampbell, Executive Realty. AMMLS
- $164,0003 bd2 ba1.9k sqft701 N Roberts St, Amarillo, TX 79107For SaleMLS ID #26-7073, Theresa E Cruz, JBRE Brokerage. AMMLS
