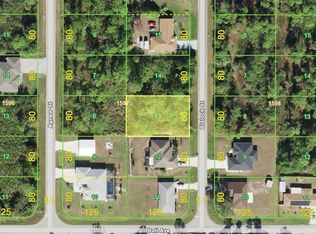
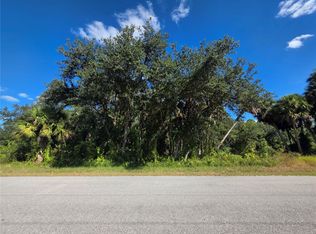
If you'd like to build your new home in the company of newer homes, this wooded, 10,000-square-foot (.23-acre) lot at 1213 Blalock Street is the right location for you! The "icing on this cake" is the low risk flood zone this lot is located in that does not require flood insurance when you build your new home. Situated in a Port Charlotte neighborhood with newer homes nearby, this property puts recreation and everyday conveniences within easy reach. Harold Avenue Regional Park and Recreation Center is approximately an eight-minute walk away, offering sports courts, playgrounds, and indoor recreation. Great supermarkets less than two miles away makes shopping convenient. Whether you
For sale
$17,000
1213 Blalock St, Punta Gorda, FL 33980
0beds
0baths
--sqft
Other
Built in ----
10,018 Square Feet Lot
$-- Zestimate®
$--/sqft
$-- HOA
What's special
- 1 day
- 32
- 3
Zillow last checked:
Listed by:
Anita Wood,
EXIT COMPASS REALTY
Source: EXIT Realty broker feed,MLS#: C7532064
Facts & features
Interior
Bedrooms & bathrooms
- Bedrooms: 0
- Bathrooms: 0
Features
- Basement:
- Has fireplace: No
Video & virtual tour
Property
Lot
- Size: 10,018 Square Feet
Details
- Parcel number: 402212278017
Construction
Type & style
- Home type: SingleFamily
- Property subtype: Other
Community & HOA
Location
- Region: Punta Gorda
Financial & listing details
- Tax assessed value: $19,500
- Annual tax amount: $458
- Date on market: 10/18/2026
- Lease term: Contact For Details
Estimated market value
Not available
Estimated sales range
Not available
Not available
Price history
| Date | Event | Price |
|---|---|---|
| 10/18/2026 | Listed for sale | $17,000 |
Source: EXIT Realty broker feed #C7532064 Report a problem | ||
Public tax history
| Year | Property taxes | Tax assessment |
|---|---|---|
| 2025 | $458 -2% | $6,131 +10% |
| 2024 | $467 +6.4% | $5,574 +10% |
| 2023 | $439 +8.1% | $5,067 +10% |
| 2022 | $406 +13.9% | $4,606 +10% |
| 2021 | $357 +4.6% | $4,187 +10% |
| 2020 | $341 +1.7% | $3,806 +10% |
| 2019 | $335 +4.5% | $3,460 +10% |
| 2018 | $321 | $3,145 -3.6% |
| 2017 | $321 0% | $3,264 -2.6% |
| 2016 | $321 -0.2% | $3,350 +10% |
| 2015 | $322 -0.3% | $3,045 +10% |
| 2014 | $323 +640.3% | $2,768 +10% |
| 2013 | $44 +2% | $2,516 -28.8% |
| 2012 | $43 -28.2% | $3,536 |
| 2011 | $60 -36.1% | $3,536 -35% |
| 2010 | $93 -31.3% | $5,440 -36% |
| 2009 | $136 | $8,500 |
Find assessor info on the county website
Monthly payment
Est. payment
Payment breakdown
Explore the cost of this home by adjusting the details. Changes won't be saved.Climate risks
Neighborhood: 33980

Similar homes
- $15,900-- bd-- ba-- sqft17126 Geoffrey Ave, Port Charlotte, FL 33948For Sale
 EXIT Realty broker feed
- $19,000-- bd-- ba-- sqft1388 Clearview Dr, Port Charlotte, FL 33953For Sale
 EXIT Realty broker feed
- $24,9002 bd2 ba1.1k sqft4303 Manatee Ln, Punta Gorda, FL 33980For Sale
 MLS ID #12009204, Jennifer Clark, Triple S Mobile Home Sales, LLC. My State MLS
- $19,000-- bd-- ba-- sqft414 Liddy St, Port Charlotte, FL 33954For Sale
 EXIT Realty broker feed
