Investor Special, Two bedroom, one bath, owner was in the process of a remodel. finish the remodel and will have a nice fix n flip or a steady rental to enhance your rental portfolio.
Under contract still showing
$80,000
1237 E Abriendo Ave, Pueblo, CO 81004
2beds
997sqft
Single Family Residence
Built in 1900
4,486 Square Feet Lot
$-- Zestimate®
$80/sqft
$-- HOA
What's special
One bathTwo bedroom
- 47 days
- 350
- 14
Zillow last checked:
Listing updated:
Listed by:
Juanita Gonzales 719-568-8414,
Rocky Mountain Realty
Source: PAR,MLS#: 242480
Facts & features
Interior
Bedrooms & bathrooms
- Bedrooms: 2
- Bathrooms: 1
- Full bathrooms: 1
- Main level bedrooms: 2
Primary bedroom
- Level: Main
- Area: 163.8
- Dimensions: 12.6 x 13
Bedroom 2
- Level: Main
- Area: 113.4
- Dimensions: 9 x 12.6
Dining room
- Level: Main
- Area: 192
- Dimensions: 16 x 12
Kitchen
- Level: Main
- Area: 147.42
- Dimensions: 12.6 x 11.7
Living room
- Level: Main
- Area: 206.91
- Dimensions: 17.1 x 12.1
Features
- Ceiling Fan(s)
- Flooring: Hardwood
- Basement: Partial,Unfinished
- Has fireplace: No
Interior area
- Total structure area: 997
- Total interior livable area: 997 sqft
Video & virtual tour
Property
Parking
- Total spaces: 2
- Parking features: 2 Car Garage Detached
- Garage spaces: 2
Features
- Patio & porch: Porch-Covered-Front, Stoop-Rear
- Fencing: Metal Fence-Rear
Lot
- Size: 4,486 Square Feet
- Dimensions: 36.6 x 122
- Features: Rock-Front
Details
- Parcel number: 1501417019
- Zoning: B-4
- Special conditions: Standard
Construction
Type & style
- Home type: SingleFamily
- Architectural style: Ranch
- Property subtype: Single Family Residence
Condition
- Year built: 1900
Utilities & green energy
- Utilities for property: Cable Connected
Community & HOA
Community
- Subdivision: Central High School
Location
- Region: Pueblo
Financial & listing details
- Price per square foot: $80/sqft
- Tax assessed value: $141,532
- Annual tax amount: $884
- Date on market: 9/26/2026
- Road surface type: Paved
Estimated market value
Not available
Estimated sales range
Not available
Not available
Price history
| Date | Event | Price |
|---|---|---|
| 11/3/2026 | Contingent | $80,000$80/sqft |
Source:  PAR #242480 Report a problem | ||
| 11/2/2026 | Listed for sale | $80,000$80/sqft |
Source: PAR #242480 Report a problem | ||
| 10/28/2026 | Contingent | $80,000$80/sqft |
Source: PAR #242480 Report a problem | ||
| 9/26/2026 | Listed for sale | $80,000+62.4%$80/sqft |
Source: PAR #242480 Report a problem | ||
| 11/5/2018 | Sold | $49,250+123.9%$49/sqft |
Source: Public Record Report a problem | ||
| 7/8/2011 | Sold | $22,000-7.2%$22/sqft |
Source: Public Record Report a problem | ||
| 5/21/2011 | Listed for sale | $23,710-60.9%$24/sqft |
Source: Muldoon Associates, Inc #638923 Report a problem | ||
| 3/28/2011 | Sold | $60,668+73.3%$61/sqft |
Source: Public Record Report a problem | ||
| 1/22/2011 | Price change | $35,000-7.9%$35/sqft |
Source: Coldwell Banker Partners #132010 Report a problem | ||
| 12/8/2010 | Price change | $38,000-17.4%$38/sqft |
Source: Coldwell Banker Partners #132010 Report a problem | ||
| 12/4/2010 | Price change | $46,000-6.1%$46/sqft |
Source: Coldwell Banker Partners #132010 Report a problem | ||
| 11/19/2010 | Price change | $49,000-5.8%$49/sqft |
Source: Coldwell Banker Partners #132010 Report a problem | ||
| 11/14/2010 | Price change | $52,000-5.5%$52/sqft |
Source: Coldwell Banker Partners #132010 Report a problem | ||
| 10/16/2010 | Listed for sale | $55,000+83.3%$55/sqft |
Source: Systems Engineering, Inc. #132010 Report a problem | ||
| 3/23/2006 | Sold | $30,000$30/sqft |
Source: Public Record Report a problem | ||
Public tax history
| Year | Property taxes | Tax assessment |
|---|---|---|
| 2026 | $863 +38.7% | $9,624 +8.7% |
| 2025 | $622 -0.7% | $8,850 -12.9% |
| 2024 | $626 -5.3% | $10,160 -0.9% |
| 2023 | $661 -3.1% | $10,250 +51% |
| 2022 | $682 +50.9% | $6,790 -2.7% |
| 2021 | $452 | $6,980 +53.1% |
| 2020 | $452 +52.2% | $4,559 +39.2% |
| 2018 | $297 | $3,276 |
| 2017 | $297 +2.2% | $3,276 +2.1% |
| 2016 | $291 | $3,210 |
| 2015 | $291 +86.9% | $3,210 -6.2% |
| 2014 | $155 -58.3% | $3,421 |
| 2013 | $373 -32.1% | $3,421 -15.9% |
| 2012 | $549 | $4,069 -19% |
| 2011 | $549 +3.2% | $5,025 -14% |
| 2010 | $532 -3% | $5,841 +0% |
| 2009 | $549 -1.8% | $5,840 -1.5% |
| 2008 | $558 0% | $5,930 |
| 2007 | $559 +4.5% | $5,930 +3.9% |
| 2006 | $535 +2.7% | $5,710 +7.3% |
| 2005 | $521 +1.4% | $5,320 |
| 2004 | $513 -1.4% | $5,320 -1.1% |
| 2003 | $521 +10.8% | $5,380 -2% |
| 2002 | $470 +13.1% | $5,490 +1.7% |
| 2001 | $416 | $5,400 |
Find assessor info on the county website
Monthly payment
Est. payment
Payment breakdown
Explore the cost of this home by adjusting the details. Changes won't be saved.Climate risks
Neighborhood: Bessemer
Nearby schools
Schools provided by the listing agent
- District: 60
Source: PAR. This data may not be complete. We recommend contacting the local school district to confirm school assignments for this home.
Similar homes
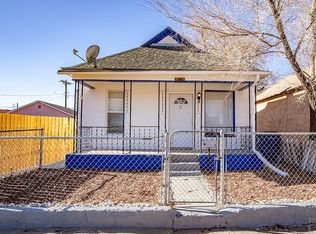
- $70,0002 bd1 ba1.2k sqft1008 Elm St, Pueblo, CO 81004For Sale
 MLS ID #239610, Nico Cordova, Cordova Investments. PAR
- $88,5002 bd1 ba741 sqft1918 Bragdon Ave, Pueblo, CO 81004For Sale
 MLS ID #2328199, Julie M. Reeves, Reeves Real Estate Llc. Royal Gorge AOR
- $79,0002 bd1 ba845 sqft1539 E 7th St, Pueblo, CO 81001For Sale
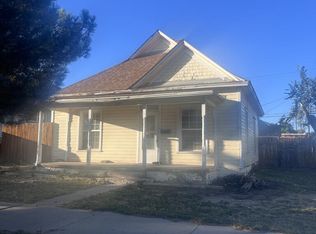 MLS ID #242973, Juanita Gonzales, Rocky Mountain Realty. PAR
- $70,0002 bd1 ba1.3k sqft1216 Berwind Ave, Pueblo, CO 81006For Sale
 MLS ID #242479, Juanita Gonzales, Rocky Mountain Realty. PAR
- $60,3002 bd1 ba916 sqft908 E 2nd Street, Pueblo, CO 81001Auction
 MLS ID #1629527, Neven Spralja, Realhome Services & Solutions. REcolorado as distributed by MLS GRID
- $49,9003 bd1 ba1k sqft619 E 11th Street, Pueblo, CO 81001For SaleMLS ID #6050131, Jeannie Medina, Realty One Group Premier Colorado. REcolorado as distributed by MLS GRID
