Brick ranch style home in Cookeville city with over 1296+/-sqft. 3BR with 1.5BA & portions of the inside have been remodeled. All cabinets have been replaced. The kitchen has a bar top eating area & enough room for a kitchen table as well. The original hrdwd floors have been restored & look beautiful. There is an oversized laundry room w/ cabinets & shelving for pantry use. New paint throughout & a 1car carport. This is a great house on the west side of the city.
For sale
$279,900
1238 Springdale Dr, Cookeville, TN 38501
3beds
1,296sqft
Single Family Residence
Built in 1967
0.38 Acres Lot
$-- Zestimate®
$216/sqft
$-- HOA
What's special
Brick ranch style homeNew paint throughout
- 5 hours
- 59
- 3
Zillow last checked:
Listing updated:
Listed by:
Chad Crouch,
Highlands Elite Real Estate LLC 931-400-8820,
Amy Crouch,
Highlands Elite Real Estate LLC
Source: UCMLS,MLS#: 248458
Facts & features
Interior
Bedrooms & bathrooms
- Bedrooms: 3
- Bathrooms: 2
- Full bathrooms: 1
- Partial bathrooms: 1
- Main level bedrooms: 1
Primary bedroom
- Level: Main
Heating
- Electric, Central
Cooling
- Central Air
Appliances
- Included: Electric Water Heater
- Laundry: Main Level
Features
- Flooring: Hardwood, Tile
- Windows: Single Pane Windows
- Basement: Crawl Space
Interior area
- Total structure area: 1,296
- Total interior livable area: 1,296 sqft
Property
Parking
- Total spaces: 1
- Covered spaces: 1
Features
- Levels: One
Lot
- Size: 0.38 Acres
- Dimensions: 100 x 165
Details
- Parcel number: 017.00
Construction
Type & style
- Home type: SingleFamily
- Property subtype: Single Family Residence
Materials
- Brick, Frame
- Roof: Composition
Condition
- Year built: 1967
Utilities & green energy
- Electric: Circuit Breakers
- Sewer: Public Sewer
- Water: Public
Community & HOA
Community
- Subdivision: Springdale
HOA
- Has HOA: No
Location
- Region: Cookeville
Financial & listing details
- Price per square foot: $216/sqft
- Tax assessed value: $105,300
- Annual tax amount: $960
- Date on market: 11/16/2026
Estimated market value
Not available
Estimated sales range
Not available
Not available
Price history
| Date | Event | Price |
|---|---|---|
| 11/16/2026 | Listed for sale | $279,900+64.6%$216/sqft |
Source:  UCMLS #248458 Report a problem | ||
| 11/13/2026 | Listed for rent | $1,500+25.5%$1/sqft |
Source: Zillow Rentals Report a problem | ||
| 8/14/2026 | Sold | $170,000-5.6%$131/sqft |
Source: UCMLS #245730 Report a problem | ||
| 7/17/2026 | Contingent | $180,000$139/sqft |
Source:  RealTracs MLS as distributed by MLS GRID #3270397 Report a problem | ||
| 7/17/2026 | Pending sale | $180,000$139/sqft |
Source:  East Tennessee Realtors #1348124 Report a problem | ||
| 7/16/2026 | Price change | $180,000-5.3%$139/sqft |
Source: UCMLS #245730 Report a problem | ||
| 7/9/2026 | Listed for sale | $190,000+131.7%$147/sqft |
Source: UCMLS #245730 Report a problem | ||
| 5/8/2025 | Listing removed | $1,195$1/sqft |
Source: Zillow Rentals Report a problem | ||
| 5/6/2025 | Listed for rent | $1,195+3.9%$1/sqft |
Source: Zillow Rentals Report a problem | ||
| 2/8/2024 | Listing removed | -- |
Source: Zillow Rentals Report a problem | ||
| 2/5/2024 | Price change | $1,150-6.1%$1/sqft |
Source: Zillow Rentals Report a problem | ||
| 11/8/2023 | Listed for rent | $1,225+54.1%$1/sqft |
Source: Zillow Rentals Report a problem | ||
| 1/15/2019 | Listing removed | $795$1/sqft |
Source: Zillow Rental Manager Report a problem | ||
| 1/7/2019 | Listed for rent | $795$1/sqft |
Source: Zillow Rental Manager Report a problem | ||
| 2/26/2008 | Sold | $82,000$63/sqft |
Source: Public Record Report a problem | ||
Public tax history
| Year | Property taxes | Tax assessment |
|---|---|---|
| 2025 | $961 +2% | $26,325 |
| 2024 | $942 | $26,325 |
| 2023 | $942 +8.7% | $26,325 |
| 2022 | $867 | $26,325 |
| 2021 | -- | $26,325 +38.7% |
| 2020 | $743 +33.8% | $18,975 |
| 2019 | $555 -18% | $18,975 |
| 2018 | $677 +0.1% | $18,975 |
| 2017 | $677 | $18,975 |
| 2016 | $677 -3.7% | $18,975 |
| 2015 | $703 +2.3% | $18,975 +2.3% |
| 2014 | $687 | $18,548 |
| 2013 | $687 -0.1% | $18,548 |
| 2012 | $688 +6.1% | $18,548 |
| 2011 | $648 | $18,548 |
| 2010 | -- | $18,548 +1.9% |
| 2009 | $659 | $18,201 |
| 2008 | $659 +7.7% | $18,201 |
| 2007 | $612 +3.7% | $18,201 |
| 2006 | $590 -1.3% | $18,201 +6.1% |
| 2005 | $597 +3% | $17,154 +3% |
| 2004 | $580 +2.9% | $16,654 -2.2% |
| 2002 | $563 | $17,023 |
| 2001 | -- | $17,023 -75% |
| 2000 | -- | $68,090 |
Find assessor info on the county website
Monthly payment
Est. payment
Payment breakdown
Explore the cost of this home by adjusting the details. Changes won't be saved.Climate risks
Neighborhood: 38501


Similar homes
- $274,5003 bd2 ba1.4k sqft460 W Stevens St, Cookeville, TN 38501For Sale
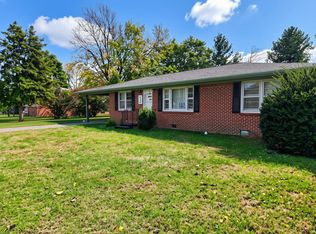
 MLS ID #247900, Donnita Hill, Elevate Real Estate. UCMLS
- $274,9003 bd1 ba1.2k sqft1283 Goodwin Rd, Cookeville, TN 38501For Sale
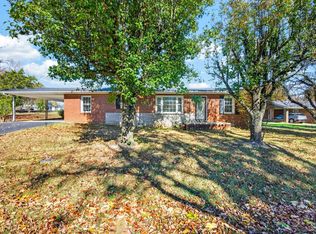 MLS ID #248298, Luke Tosh, Real Estate Professionals of TN. UCMLS
- $278,5003 bd2 ba1.4k sqft762 Spring Valley Rd, Cookeville, TN 38501For Sale
 MLS ID #247943, Kevin Cummins, First Realty Company. UCMLS
- $259,9003 bd2 ba1.1k sqft3116 McDonald Rd, Cookeville, TN 38501For Sale
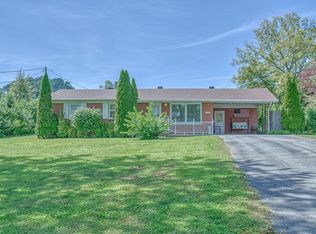 MLS ID #248273, Gina Key, American Way Real Estate. UCMLS
- $274,9003 bd2 ba1.2k sqft1805 N Whitney Ave, Cookeville, TN 38501For SaleMLS ID #246702, Clark Adcock, The Realty Firm - Smithville. UCMLS
- $299,0003 bd2 ba1.4k sqft1539 McClain Rd, Cookeville, TN 38501For SaleMLS ID #246229, Tiana Bilbrey, The Property Company. UCMLS
- $279,9003 bd2 ba1.6k sqft250 E 16th St, Cookeville, TN 38501For SaleMLS ID #245144, Deanna Jenkins, First Realty Company. UCMLS
- $269,9002 bd2 ba1.1k sqft433 Bradley Dr, Cookeville, TN 38501For SaleMLS ID #246701, Patt M. Judd, The Realty Firm. UCMLS
- $274,9293 bd2 ba1.2k sqft244 Boatman St, Cookeville, TN 38501For SaleMLS ID #246941, Heather Skender-Newton, Skender-Newton Realty. UCMLS
- $299,9292 bd2 ba1.4k sqft310 Denton Ave, Cookeville, TN 38501For SaleMLS ID #248279, Heather Skender-Newton, Skender-Newton Realty. UCMLS
- $229,9993 bd1 ba1k sqft156 Long Meadow Dr, Cookeville, TN 38501For SaleMLS ID #248261, Tammy Jo Atkins, Highlands Elite Real Estate LLC - Baxter. UCMLS
- $229,9003 bd2 ba1.3k sqft1904 N Dixie Ave, Cookeville, TN 38501For SaleMLS ID #246924, Natalie Adcock, The Realty Firm - Smithville. UCMLS
- $219,9293 bd1 ba906 sqft1138 Syracuse St, Cookeville, TN 38501For SaleMLS ID #248266, Heather Skender-Newton, Skender-Newton Realty. UCMLS
- $307,4003 bd3 ba1.5k sqft266 E Bangham Rd, Cookeville, TN 38501For SaleMLS ID #246404, Marcia Steranka, American Way Real Estate. UCMLS
- $324,9003 bd2 ba1.6k sqft1435 Cumber Ln, Cookeville, TN 38501For SaleMLS ID #247616, Joshua Meadows, Highlands Elite Real Estate LLC. UCMLS
- $289,9003 bd2 ba1.2k sqft133 Chestnut Rdg, Sparta, TN 38583For SaleMLS ID #248251, Landon Dickerson, True North Real Estate Services, LLC. UCMLS
- $315,0002 bd3 ba1.7k sqft1080 Old Cavalry Rd, Cookeville, TN 38506For SaleMLS ID #248276, Chad Crouch, Highlands Elite Real Estate LLC. UCMLS
- $264,5003 bd1 ba1k sqft145 Willie Jarvis Rd, Sparta, TN 38583For SaleMLS ID #248456, Stephan Manderschied, WatersEdge Realty Group, LLC. UCMLS
- $269,9003 bd2 ba1.6k sqft380 Holiday Haven Rd, Smithville, TN 37166For Sale
 MLS ID #3635924, MITCHELL BOWMAN. RealTracs MLS as distributed by MLS GRID
- $269,9993 bd2 ba1.2k sqft1767 Eastlake Dr, Cookeville, TN 38506For SaleMLS ID #246643, Trey Bolin, Highlands Elite Real Estate LLC. UCMLS
