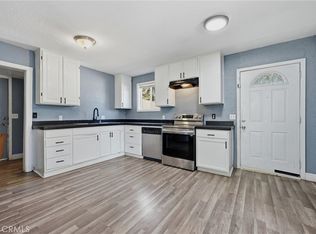
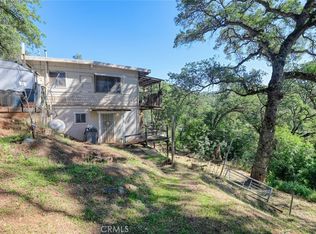
3 bedroom 2 baths house in good condition, with 2 car garage. Originally manufactured home but was extended. Nice place to live or as income producing property!
Active
$225,000
12902 E Highway 20, Clearlake Oaks, CA 95423
3beds
1,200sqft
Single Family Residence
Built in 1962
4,791 Square Feet Lot
$-- Zestimate®
$188/sqft
$-- HOA
What's special
- 2088 days
- 79
- 7
Zillow last checked:
Listing updated:
Listed by:
Moussa Btaiche DRE #01018479 707-580-7385,
RE/MAX Gold 707-422-4411
Source: BAREIS,MLS#: 21928582 Originating MLS: Northern Solano
Facts & features
Interior
Bedrooms & bathrooms
- Bedrooms: 3
- Bathrooms: 2
- Full bathrooms: 2
Rooms
- Room types: Other
Bedroom
- Level: Main
Bathroom
- Level: Main
Kitchen
- Level: Main
Living room
- Level: Main
Heating
- Wall Furnace, Other
Cooling
- Other
Appliances
- Laundry: No Hookups, None
Features
- Flooring: Carpet
- Basement: None
- Has fireplace: No
Interior area
- Total structure area: 1,200
- Total interior livable area: 1,200 sqft
Property
Parking
- Total spaces: 2
- Parking features: Detached
- Garage spaces: 2
Features
- Levels: One
- Stories: 1
Lot
- Size: 4,791 Square Feet
- Features: Shape Regular
Details
- Additional structures: Other
- Parcel number: 035172380000
- Special conditions: Standard
Construction
Type & style
- Home type: SingleFamily
- Architectural style: Ranch
- Property subtype: Single Family Residence
Materials
- Wood Siding
- Roof: Composition
Condition
- Year built: 1962
Utilities & green energy
- Sewer: Public Sewer
- Water: Public
- Utilities for property: Electricity Connected, Public
Community & HOA
HOA
- Has HOA: No
Location
- Region: Clearlake Oaks
Financial & listing details
- Price per square foot: $188/sqft
- Tax assessed value: $108,087
- Date on market: 11/10/2019
- Electric utility on property: Yes
Estimated market value
Not available
Estimated sales range
Not available
$1,716/mo
Price history
| Date | Event | Price |
|---|---|---|
| 8/9/2025 | Listed for sale | $225,000-10%$188/sqft |
Source:  BAREIS #21928582 Report a problem | ||
| 5/18/2023 | Price change | $250,000-9.1%$208/sqft |
Source: BAREIS #21928582 Report a problem | ||
| 3/6/2023 | Price change | $275,000+22.2%$229/sqft |
Source: BAREIS #21928582 Report a problem | ||
| 10/9/2022 | Listed for sale | $225,000-18.2%$188/sqft |
Source: BAREIS #21928582 Report a problem | ||
| 3/11/2022 | Price change | $275,000+22.2%$229/sqft |
Source:  CRMLS #LC19281345 Report a problem | ||
| 10/14/2021 | Listed for sale | $225,000+28.6%$188/sqft |
Source: CRMLS #LC19281345 Report a problem | ||
| 3/19/2021 | Price change | $175,000+10.1%$146/sqft |
Source: BAREIS #21928582 Report a problem | ||
| 10/25/2020 | Listed for sale | $159,000+6%$133/sqft |
Source: RE/MAX Gold of Fairfield #21928582 Report a problem | ||
| 11/11/2019 | Listed for sale | $150,000+57.9%$125/sqft |
Source: RE/MAX Gold of Fairfield #21928582 Report a problem | ||
| 7/16/2018 | Sold | $95,000-26.9%$79/sqft |
Source: Public Record Report a problem | ||
| 6/1/2018 | Pending sale | $130,000$108/sqft |
Source: Shore Line Realty, Inc. #LC18113886 Report a problem | ||
| 5/15/2018 | Listed for sale | $130,000$108/sqft |
Source: Shore Line Realty, Inc. #LC18113886 Report a problem | ||
| 3/18/2018 | Listing removed | $130,000$108/sqft |
Source: Rodeo Realty #LC17209544 Report a problem | ||
| 12/7/2017 | Price change | $130,000-7.1%$108/sqft |
Source: Rodeo Realty #LC17209544 Report a problem | ||
| 9/10/2017 | Listed for sale | $140,000+100%$117/sqft |
Source: Rodeo Realty #LC17209544 Report a problem | ||
| 6/12/2015 | Sold | $70,000-8.5%$58/sqft |
Source: Public Record Report a problem | ||
| 5/12/2015 | Price change | $76,500-10%$64/sqft |
Source: CENTURY 21 NorthBay Alliance #lc15089260 Report a problem | ||
| 4/28/2015 | Price change | $85,000-22.7%$71/sqft |
Source: Owner Report a problem | ||
| 4/27/2015 | Listed for sale | $110,000+83.3%$92/sqft |
Source: Owner Report a problem | ||
| 8/25/2003 | Sold | $60,000$50/sqft |
Source: Public Record Report a problem | ||
Public tax history
| Year | Property taxes | Tax assessment |
|---|---|---|
| 2026 | -- | $108,087 +2% |
| 2025 | $1,250 +1% | $105,968 +2% |
| 2024 | $1,237 +1% | $103,892 +2% |
| 2023 | $1,224 +5% | $101,856 +2% |
| 2022 | $1,167 -2.9% | $99,860 +2% |
| 2021 | $1,202 +0.5% | $97,903 +1% |
| 2020 | $1,196 +4.3% | $96,900 +2% |
| 2019 | $1,147 +23.9% | $95,000 +28.5% |
| 2018 | $925 +4.8% | $73,937 +2% |
| 2017 | $883 +4.4% | $72,488 +20.8% |
| 2016 | $846 +31.1% | $60,000 |
| 2015 | $645 +0.1% | $60,000 |
| 2014 | $644 +1.1% | $60,000 |
| 2013 | $637 -2.9% | $60,000 |
| 2012 | $656 -0.1% | $60,000 |
| 2011 | $657 -31% | $60,000 -32.8% |
| 2010 | $952 +1.9% | $89,319 +1.8% |
| 2008 | $934 +5.7% | $87,776 +5.6% |
| 2007 | $884 +35.7% | $83,158 +33.2% |
| 2006 | $651 +2.5% | $62,424 +2% |
| 2005 | $635 +5.6% | $61,200 +2% |
| 2004 | $602 +90.9% | $60,000 +72.5% |
| 2003 | $315 +2% | $34,786 +2% |
| 2002 | $309 +2.1% | $34,105 +2% |
| 2001 | $302 +2% | $33,438 +2% |
| 2000 | $296 | $32,783 |
Find assessor info on the county website
Monthly payment
Est. payment
Payment breakdown
Explore the cost of this home by adjusting the details. Changes won't be saved.Climate risks
Neighborhood: 95423
- $118,3002 bd2 ba1k sqft12888 E Highway 20, Clearlake Oaks, CA 95423Off Market
- $107,4002 bd1 ba875 sqft12922 E Highway 20, Clearlake Oaks, CA 95423Off Market
- $9,348-- bd-- ba-- sqft12911 Lakeview Dr, Clearlake Oaks, CA 95423Off Market
- $104,9001 bd1 ba620 sqft12891 Lakeview Dr, Clearlake Oaks, CA 95423Off Market
Similar homes
- $220,0003 bd2 ba1k sqft12818 E Highway 20, Clearlake Oaks, CA 95423For Sale
 MLS ID #LC26220347, Jennifer Perez, Pivniska Real Estate Group. CRMLS
- $250,0003 bd3 ba1.5k sqft12740 Island Cir, Clearlake Oaks, CA 95423For Sale
 MLS ID #LC26212440, Casey Marsh, Konocti Realty. CRMLS
- $199,0003 bd2 ba1k sqft12637 Lakeview Dr, Clearlake Oaks, CA 95423For Sale
 MLS ID #LC26067511, Hazel Wayman, RE/MAX Gold Lake County. CRMLS
- $195,0003 bd2 ba960 sqft12698 E Highway 20, Clearlake Oaks, CA 95423For Sale
 MLS ID #LC26223620, Mary Tominia, Shore Line Realty, Inc.. CRMLS
