This is a 864 square foot, 1.0 bathroom, single family home. This home is located at 12925 John Reynolds Rd, Galveston, TX 77554.
Foreclosed
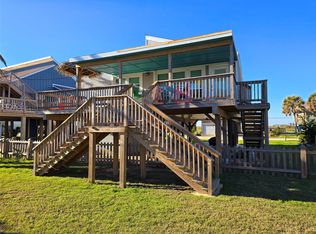
Street View
Est. $430,100
12925 John Reynolds Rd, Galveston, TX 77554
--beds
1baths
864sqft
SingleFamily
Built in 1965
5,898 Square Feet Lot
$430,100 Zestimate®
$498/sqft
$-- HOA
Overview
- 83 days |
- 10 |
- 0 |
Facts & features
Interior
Bedrooms & bathrooms
- Bathrooms: 1
Heating
- Other
Cooling
- Central
Features
- Flooring: Carpet
- Has fireplace: Yes
Interior area
- Total interior livable area: 864 sqft
Property
Parking
- Parking features: Garage - Attached
Features
- Exterior features: Other, Cement / Concrete
Lot
- Size: 5,898 Square Feet
Details
- Parcel number: 176500000027000
Construction
Type & style
- Home type: SingleFamily
Materials
- concrete
- Foundation: Piling
- Roof: Built-up
Condition
- Year built: 1965
Community & HOA
Location
- Region: Galveston
Financial & listing details
- Price per square foot: $498/sqft
- Tax assessed value: $510,280
- Annual tax amount: $8,651
Visit our professional directory to find a foreclosure specialist in your area that can help with your home search.
Find a foreclosure agentForeclosure details
Estimated market value
$430,100
$409,000 - $452,000
$2,131/mo
Price history
| Date | Event | Price |
|---|---|---|
| 4/7/2026 | Sold | -- |
Source: Public Record Report a problem | ||
| 2/12/2026 | Listing removed | $3,500$4/sqft |
Source: | ||
| 2/5/2026 | Price change | $439,900-2.2%$509/sqft |
Source: | ||
| 2/2/2026 | Price change | $449,900-10%$521/sqft |
Source: | ||
| 1/14/2026 | Price change | $3,500-6.7%$4/sqft |
Source: | ||
| 1/14/2026 | Price change | $499,900-10.7%$579/sqft |
Source: | ||
| 8/20/2025 | Listed for rent | $3,750-6.3%$4/sqft |
Source: | ||
| 8/20/2025 | Price change | $559,900-5.9%$648/sqft |
Source: | ||
| 6/1/2025 | Listing removed | $4,000$5/sqft |
Source: | ||
| 12/23/2024 | Listed for rent | $4,000-4.8%$5/sqft |
Source: | ||
| 11/24/2024 | Listed for sale | $595,000+2.6%$689/sqft |
Source: | ||
| 6/8/2024 | Listing removed | -- |
Source: | ||
| 6/7/2024 | Listing removed | -- |
Source: | ||
| 5/17/2024 | Listed for rent | $4,200$5/sqft |
Source: | ||
| 5/9/2024 | Listed for sale | $580,000+1.9%$671/sqft |
Source: | ||
| 12/26/2023 | Listing removed | -- |
Source: | ||
| 11/17/2023 | Listed for rent | $4,200$5/sqft |
Source: | ||
| 7/22/2023 | Listing removed | -- |
Source: | ||
| 6/28/2023 | Pending sale | $569,000$659/sqft |
Source: | ||
| 6/19/2023 | Listed for sale | $569,000$659/sqft |
Source: | ||
Public tax history
| Year | Property taxes | Tax assessment |
|---|---|---|
| 2025 | $8,651 -3.4% | $510,280 -2.7% |
| 2024 | $8,954 +11.1% | $524,620 +12.1% |
| 2023 | $8,062 +28.7% | $468,100 +48.5% |
| 2022 | $6,264 -5.1% | $315,153 -2.9% |
| 2021 | $6,598 +35.8% | $324,640 +48.4% |
| 2020 | $4,859 -1% | $218,710 +3.7% |
| 2019 | $4,908 +5.9% | $211,000 +4.2% |
| 2018 | $4,636 | $202,570 +6.4% |
| 2017 | $4,636 +1.5% | $190,460 +0.2% |
| 2016 | $4,566 +10.5% | $190,000 +3.1% |
| 2015 | $4,131 +17.8% | $184,350 +29.3% |
| 2014 | $3,508 | $142,550 |
| 2013 | -- | $142,550 |
| 2012 | -- | $142,550 |
| 2011 | -- | $142,550 |
| 2010 | -- | $142,550 +38.3% |
| 2009 | -- | $103,090 -24.6% |
| 2008 | -- | $136,780 |
| 2007 | -- | $136,780 |
| 2006 | -- | $136,780 +45.2% |
| 2005 | -- | $94,230 +3.4% |
| 2004 | -- | $91,170 +0.7% |
| 2003 | -- | $90,570 +12.6% |
| 2002 | -- | $80,420 |
| 2001 | -- | $80,420 |
Find assessor info on the county website
Monthly payment
Estimated monthly payment$1,822
All calculations are estimates and provided by Zillow, Inc. for informational purposes only. Actual amounts may vary.
HOA fees may include property taxes on listings classified as Co-Ops. Contact the listing agent and/or owner for fee details.
Mortgage interest rates are dependent on a number of factors, including credit score, down payment, and repayment length. Interest rate data provided by Zillow Group Marketplace, Inc. as of 1/1/1970 from various mortgage lenders with which we have lead or other similar arrangements; the Estimated Payment is an average of those rates.
See how much you could borrow to make a competitive offer.
Climate risks
Neighborhood: Bermuda Beach
Nearby schools
GreatSchools rating
- 9/10Oppe Elementary SchoolGrades: PK-4Distance: 5.1 mi
- 5/10AIM College & Career PrepGrades: 8-12Distance: 7.4 mi
- 4/10Weis Middle SchoolGrades: 5-6Distance: 5.8 mi


- Texas
- Galveston County
- Galveston
- 77554
- Bermuda Beach
- 12925 John Reynolds Rd
Nearby cities
Nearby neighborhoods
Nearby zip codes
Other Galveston Topics
