This property will be sold through the applicable foreclosure auction process. The property is being sold as is and the occupancy status is assumed to be occupied. The buyer assumes all responsibility for the property condition and occupancy. This is a 3 bedroom 2 bathroom with a square foot of 1610 located at 131 CYMBIDIUM CIR, SOUTH SAN FRANCISCO, CA 94080
Pre-foreclosure
Est. $1,532,100
131 Cymbidium Cir, South San Francisco, CA 94080
3beds
1,610sqft
SingleFamily
Built in 2000
3,484 Square Feet Lot
$1,532,100 Zestimate®
$952/sqft
$-- HOA
Overview
- 297 days
- 223
- 5
Facts & features
Interior
Bedrooms & bathrooms
- Bedrooms: 3
- Bathrooms: 3
- Full bathrooms: 2
- 1/2 bathrooms: 1
Heating
- Other
Cooling
- None
Features
- Basement: Unfinished
Interior area
- Total interior livable area: 1,610 sqft
Property
Parking
- Parking features: Garage - Attached
Lot
- Size: 3,484 Square Feet
Details
- Parcel number: 010455060
Construction
Type & style
- Home type: SingleFamily
Condition
- Year built: 2000
Community & HOA
Location
- Region: South San Francisco
Financial & listing details
- Price per square foot: $952/sqft
- Tax assessed value: $1,205,796
Foreclosure details
Estimated market value
$1,532,100
$1.42M - $1.64M
$5,232/mo
Price history
| Date | Event | Price |
|---|---|---|
| 10/20/2004 | Sold | $835,000+92.8%$519/sqft |
Source: Public Record Report a problem | ||
| 11/24/1999 | Sold | $433,000$269/sqft |
Source: Public Record Report a problem | ||
Public tax history
| Year | Property taxes | Tax assessment |
|---|---|---|
| 2026 | -- | $1,205,796 +2% |
| 2025 | $13,564 +0.7% | $1,182,154 +2% |
| 2024 | $13,470 +1.5% | $1,158,976 +2% |
| 2023 | $13,278 +6.1% | $1,136,252 +2% |
| 2022 | $12,512 +1.3% | $1,113,974 +2% |
| 2021 | $12,353 +1.2% | $1,092,132 +1% |
| 2020 | $12,204 +1.1% | $1,080,934 +2% |
| 2019 | $12,069 +2.4% | $1,059,740 +2% |
| 2018 | $11,780 +2.4% | $1,038,962 +2% |
| 2017 | $11,508 +7.6% | $1,018,592 +8.4% |
| 2016 | $10,692 +22.6% | $940,000 +3.2% |
| 2015 | $8,720 | $911,000 +19.9% |
| 2014 | $8,720 | $760,000 +2.7% |
| 2013 | -- | $740,000 +2.8% |
| 2012 | -- | $720,000 |
| 2011 | -- | $720,000 |
| 2010 | -- | $720,000 |
| 2009 | -- | $720,000 -20% |
| 2008 | -- | $900,000 +3.6% |
| 2007 | -- | $868,734 +2% |
| 2006 | -- | $851,700 |
| 2005 | -- | $851,700 +82% |
| 2004 | -- | $468,078 +1.9% |
| 2003 | -- | $459,500 +2% |
| 2002 | -- | $450,492 +2% |
| 2001 | -- | $441,660 +2% |
| 2000 | -- | $433,000 |
Find assessor info on the county website
Monthly payment
Climate risks
Neighborhood: Serra Highlands
- $1,525,6004 bd3 ba1.8k sqft133 Cymbidium Cir, South San Francisco, CA 94080Off Market
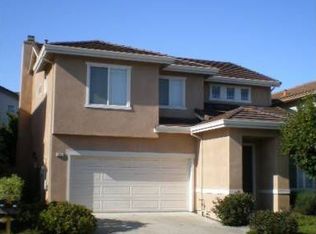
- $1,572,3004 bd2 ba1.8k sqft128 Cymbidium Cir, South San Francisco, CA 94080Off Market
- $1,767,6004 bd2 ba1.8k sqft135 Cymbidium Cir, South San Francisco, CA 94080Off Market
- $1,671,1004 bd2 ba1.8k sqft7 Miltonia Dr, South San Francisco, CA 94080Off Market
Similar homes
- $1,488,8885 bd3 ba2.3k sqft2775 Tipperary Ave, South San Francisco, CA 94080For Sale
 MLS ID #41150639, Yamin Ayesh. Bay East AOR
- $1,080,0003 bd3 ba1.3k sqft307 Heather Way, South San Francisco, CA 94080For Sale
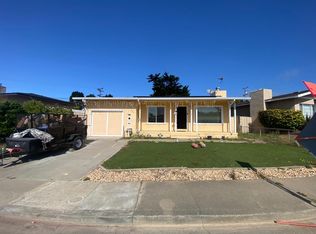 MLS ID #ML82063470, Martin Zhuang. MLSListings Inc
- $--4 bd2 ba1k sqft710 Madrid St, San Francisco, CA 94112Auction
 Auction.com 2
- $1,288,0003 bd1 ba990 sqft10 Bradford Dr, South San Francisco, CA 94080For Sale
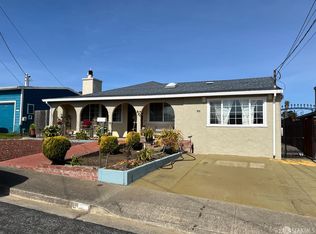 MLS ID #426114522, Margaret M. Chang DRE #01224010, Comax Realty, Inc.. SFAR
