Here's your chance to add instant value in a home with great bones. This four bedroom, two bath, two story home offers just about 1,751 square feet of living space and was built in 2008. The home is ready for some cosmetic updating, giving the right buyer a fantastic opportunity to build sweat equity and make it their own. Whether you're an investor looking for your next project or a buyer ready to put in some work for long term gain, this home offers real upside in a solid location. Bring your vision and make this one shine.
For sale
$414,900
131 S Sol Street, Visalia, CA 93292
4beds
1,751sqft
Single Family Residence, Residential
Built in 2008
6,759 Square Feet Lot
$413,800 Zestimate®
$237/sqft
$-- HOA
What's special
Two story homeFour bedroomTwo bath
- 50 days
- 130
- 1
Zillow last checked:
Listing updated:
Listed by:
Jacob Fraga 559-334-7990,
Independent Broker Network
Source: TCMLS,MLS#: 244060
Facts & features
Interior
Bedrooms & bathrooms
- Bedrooms: 4
- Bathrooms: 2
- Full bathrooms: 2
- Main level bathrooms: 1
Heating
- Central
Cooling
- Central Air
Features
- Has fireplace: No
Interior area
- Total structure area: 1,751
- Total interior livable area: 1,751 sqft
Property
Parking
- Total spaces: 2
- Parking features: Garage
- Garage spaces: 2
Features
- Stories: 2
Lot
- Size: 6,759 Square Feet
Details
- Parcel number: 103490063000
Construction
Type & style
- Home type: SingleFamily
- Property subtype: Single Family Residence, Residential
Materials
- Roof: Composition
Condition
- New construction: No
- Year built: 2008
Utilities & green energy
- Sewer: Public Sewer
- Water: Public
- Utilities for property: Electricity Connected, Natural Gas Connected, Sewer Connected, Water Connected
Community & HOA
HOA
- Has HOA: No
Location
- Region: Visalia
Financial & listing details
- Price per square foot: $237/sqft
- Tax assessed value: $245,071
- Date on market: 9/12/2026
- Electric utility on property: Yes
Estimated market value
$413,800
$393,000 - $434,000
$2,284/mo
Price history
| Date | Event | Price |
|---|---|---|
| 9/12/2026 | Listed for sale | $414,900+111.8%$237/sqft |
Source:  TCMLS #244060 Report a problem | ||
| 7/13/2017 | Listing removed | $1,375$1/sqft |
Source: Mill Creek Management & Real Estate Sales, Inc. Report a problem | ||
| 6/9/2017 | Listed for rent | $1,375+6.2%$1/sqft |
Source: Mill Creek Management & Real Estate Sales, Inc. Report a problem | ||
| 1/22/2015 | Listing removed | $1,295$1/sqft |
Source: Mill Creek Management & Real Estate Sales Report a problem | ||
| 1/16/2015 | Listed for rent | $1,295$1/sqft |
Source: Mill Creek Management & Real Estate Sales Report a problem | ||
| 3/26/2014 | Sold | $195,900$112/sqft |
Source: TCMLS #105816 Report a problem | ||
| 11/21/2013 | Price change | $195,900-5.4%$112/sqft |
Source: RE/MAX ALL ESTATES #105816 Report a problem | ||
| 11/9/2013 | Listed for sale | $207,000+9.8%$118/sqft |
Source: RE/MAX ALL ESTATES #105816 Report a problem | ||
| 3/14/2008 | Sold | $188,500$108/sqft |
Source: Public Record Report a problem | ||
Public tax history
| Year | Property taxes | Tax assessment |
|---|---|---|
| 2026 | -- | $245,071 +2% |
| 2025 | $2,921 +2.6% | $240,267 +2% |
| 2024 | $2,846 +2.5% | $235,557 +2% |
| 2023 | $2,776 +3.7% | $230,939 +2% |
| 2022 | $2,676 +1.2% | $226,411 +2% |
| 2021 | $2,645 +0.7% | $221,972 +1% |
| 2020 | $2,627 +2.7% | $219,696 +2% |
| 2019 | $2,558 +2.2% | $215,388 +2% |
| 2018 | $2,503 +1.3% | $211,165 +2% |
| 2017 | $2,471 -2.3% | $207,024 +2% |
| 2016 | $2,528 | $202,965 +1.5% |
| 2015 | $2,528 +18.4% | $199,916 +24.9% |
| 2014 | $2,134 | $160,000 +20.3% |
| 2013 | -- | $133,000 +4.7% |
| 2012 | -- | $127,000 -8.6% |
| 2011 | -- | $139,000 |
Find assessor info on the county website
Monthly payment
Est. payment
Payment breakdown
Explore the cost of this home by adjusting the details. Changes won't be saved.Climate risks
Neighborhood: Riverwood


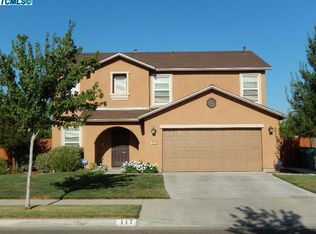

Similar homes
- $--4 bd3 ba2.6k sqft1127 N Citrus Ct, Visalia, CA 93292Auction
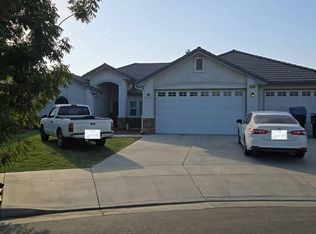 Auction.com 2
- $439,0004 bd2 ba1.9k sqft3939 E Laura Avenue, Visalia, CA 93292For Sale
 MLS ID #244400, Robyn E Icenhower, Independent Broker Network. TCMLS
- $398,0003 bd2 ba1.6k sqft3942 E Four Creeks Court, Visalia, CA 93292For Sale
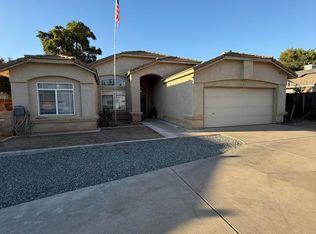 MLS ID #243142, Gilbert Requejo, ERA Valley Pro Realty. TCMLS
- $364,0003 bd2 ba1.3k sqft3816 E Acequia Ave, Visalia, CA 93292For Sale
 MLS ID #ML82050650, Jazmine Ramirez. MLSListings Inc
