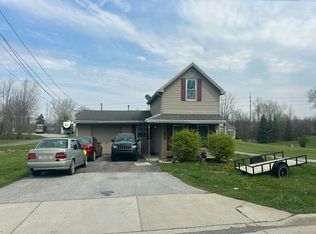
Welcome to 133 S. Roberts Avenue in Lima! This charming 3-bedroom, 1-bath ranch in the Bath School District offers comfortable, single-level living with a
fresh, inviting interior. Step inside to find updated flooring, neutral paint colors, and a spacious living room featuring a cozy fireplace. The bright kitchen
offers white cabinetry and plenty of natural light. Outside, enjoy a covered front porch and a spacious backyard with mature trees, a deck perfect for
relaxing or entertaining, and a storage shed. Priced at $149,900, this move-in-ready home is a great opportunity. Schedule your private showing today!
For sale
$149,900
133 S Roberts Ave, Lima, OH 45804
3beds
1,236sqft
Single Family Residence
Built in 1963
-- sqft lot
$126,600 Zestimate®
$121/sqft
$-- HOA
What's special
Storage shedComfortable single-level livingNeutral paint colorsCovered front porchPlenty of natural lightFresh inviting interiorWhite cabinetry
- 6 hours
- 46
- 10
Zillow last checked:
Listing updated:
Listed by:
Seth Ciminillo 419-302-2159,
Dye Real Estate & Land Company
Source: WCAR OH,MLS#: 311998
Facts & features
Interior
Bedrooms & bathrooms
- Bedrooms: 3
- Bathrooms: 1
- Full bathrooms: 1
Heating
- Forced Air
Cooling
- Central Air
Appliances
- Included: Electric Cooktop, Oven
Features
- Flooring: Laminate
Interior area
- Total structure area: 1,236
- Total interior livable area: 1,236 sqft
Property
Parking
- Parking features: None
Details
- Parcel number: 37320804007.000
- Zoning description: Residential
Construction
Type & style
- Home type: SingleFamily
- Architectural style: Ranch
- Property subtype: Single Family Residence
Materials
- Foundation: Slab
Condition
- Year built: 1963
Utilities & green energy
- Sewer: Public Sewer
- Water: Public
Community & HOA
HOA
- Has HOA: No
Location
- Region: Lima
Financial & listing details
- Price per square foot: $121/sqft
- Tax assessed value: $69,900
- Annual tax amount: $1,085
- Date on market: 10/22/2026
- Listing terms: Cash,Conventional,FHA
Estimated market value
$126,600
$110,000 - $143,000
$1,308/mo
Price history
| Date | Event | Price |
|---|---|---|
| 10/22/2026 | Listed for sale | $149,900+99.9%$121/sqft |
Source:  WCAR OH #311998 Report a problem | ||
| 1/27/2023 | Sold | $75,000-1.3%$61/sqft |
Source: Public Record Report a problem | ||
| 8/25/2006 | Sold | $76,000+29.9%$61/sqft |
Source: Public Record Report a problem | ||
| 10/14/1997 | Sold | $58,500$47/sqft |
Source: Public Record Report a problem | ||
Public tax history
| Year | Property taxes | Tax assessment |
|---|---|---|
| 2025 | $1,085 -0.5% | $24,470 |
| 2024 | $1,090 -38.7% | $24,470 +4.9% |
| 2023 | $1,778 +69.2% | $23,320 |
| 2022 | $1,051 -0.6% | $23,320 |
| 2021 | $1,057 +10.1% | $23,320 +17.5% |
| 2020 | $960 -2.6% | $19,850 |
| 2019 | $985 +2.5% | $19,850 |
| 2018 | $961 -0.5% | $19,850 |
| 2017 | $966 +1% | $19,850 |
| 2016 | $957 +0.1% | $19,850 |
| 2015 | $956 -11.8% | $19,850 -8.1% |
| 2014 | $1,084 -0.1% | $21,600 |
| 2013 | $1,085 +2.7% | $21,600 |
| 2012 | $1,057 +14.9% | $21,600 |
| 2011 | $920 +0.4% | $21,600 |
| 2010 | $916 +0.9% | $21,600 |
| 2009 | $909 +14.4% | $21,600 +15.1% |
| 2008 | $794 -1.1% | $18,760 |
| 2007 | $803 -15.1% | $18,760 |
| 2006 | $946 +6.2% | $18,760 +5.7% |
| 2005 | $890 -5.1% | $17,745 |
| 2004 | $938 +12.9% | $17,745 |
| 2003 | $831 +11.5% | $17,745 +12.7% |
| 2002 | $745 +2.4% | $15,750 |
| 2001 | $727 +0.7% | $15,750 |
| 2000 | $723 +24.4% | $15,750 +21.6% |
| 1999 | $581 | $12,950 |
Find assessor info on the county website
Monthly payment
Est. payment
Payment breakdown
Explore the cost of this home by adjusting the details. Changes won't be saved.Climate risks
Neighborhood: 45804
Similar homes
- $--3 bd2 ba1.5k sqft1649 Reservoir Rd, Lima, OH 45804Auction
 Auction.com 1
- $159,9003 bd1 ba1.3k sqft1155 Franklin St, Lima, OH 45804For Sale
 MLS ID #10007093, Keith M. Degnan, Key Realty. NORIS
- $174,9003 bd1 ba988 sqft115 Blackburn Dr, Lima, OH 45805For Sale

 MLS ID #311992, Lynn Culver, Berkshire Hathaway Professional Realty. WCAR OH
- $--3 bd1 ba1.3k sqft1505 Karen Ave, Lima, OH 45801AuctionServiceLink Auction
- $182,5003 bd2 ba1.3k sqft1810 Latham Ave, Lima, OH 45805For SaleMLS ID #311962, Lisa K Cogley, Berkshire Hathaway Professional Realty. WCAR OH
- $180,0003 bd2 ba1.2k sqft2317 Harding Hwy, Lima, OH 45804For SaleMLS ID #311191, Jennifer Stemen, Superior Plus Realtors. WCAR OH
- $169,9004 bd2 ba1.6k sqft434 Prospect Ave, Lima, OH 45804For SaleMLS ID #311883, Traci Mendenhall, Hartsock Realty. WCAR OH
- $174,5003 bd2 ba1.4k sqft2308 N Metcalf St, Lima, OH 45801For SaleMLS ID #311946, Cheryl Faulder, Ron Spencer Real Estate. WCAR OH
- $139,0003 bd2 ba1.2k sqft1008 Fairview Ave, Lima, OH 45804For Sale
 MLS ID #1047350, Siham Wiltshire, Realty 2000 Group. WRIST
- $130,0003 bd1 ba1.4k sqft559 Prospect Ave, Lima, OH 45804For SaleMLS ID #310971, Seth Ciminillo, Dye Real Estate & Land Company. WCAR OH
- $130,0002 bd2 ba766 sqft829 Michael Ave, Lima, OH 45804For SaleMLS ID #311929, Shaun Richardson, EXP Realty-Dublin. WCAR OH
- $109,0003 bd1 ba960 sqft604 Fairview Ave, Lima, OH 45804For SaleMLS ID #311952, Josh Parker, Ron Spencer Real Estate. WCAR OH
- $119,0003 bd2 ba1.1k sqft1127 E Franklin St, Lima, OH 45804For SaleMLS ID #311323, Autumn Muchow, Binkley Real Estate- Wapakoneta. WCAR OH
- $149,0002 bd2 ba1.2k sqft617 N Main St, Lima, OH 45801For SaleMLS ID #1048805, Beth Roe, Realty 2000 Group. WRIST
- $169,9003 bd1 ba1.1k sqft735 Holly St, Lima, OH 45804For SaleMLS ID #311022, Tyson Lawrence, Dye Real Estate & Land Company. WCAR OH
- $144,0002 bd1 ba1.1k sqft615 Ilata Ave, Lima, OH 45805For SaleMLS ID #311885, Collin Etzkorn, Schrader Realty. WCAR OH
- $149,5003 bd2 ba1k sqft3819 Allentown Rd, Lima, OH 45807For SaleMLS ID #311109, Molly Blodgett, Cowan, Realtors. WCAR OH
- $123,0003 bd1 ba1.1k sqft540 McPheron Ave, Lima, OH 45804For SaleMLS ID #310856, Seth Ciminillo, Dye Real Estate & Land Company. WCAR OH
- $144,9003 bd1 ba1.1k sqft527 Woodward Ave, Lima, OH 45805For SaleMLS ID #311512, Nichole Hoehn, CCR Realtors. WCAR OH
