$55,000
2 bd|1 ba|840 sqft
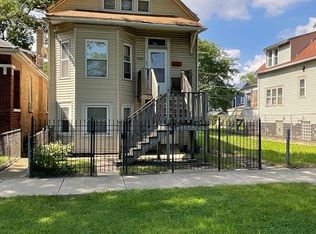
1329 W 71st St, Chicago, IL 60636
Sold
Zillow last checked:
Listing updated:
Nadia Meza 773-717-5364,
Classic Realty Group Prestige,
Alma Meza,
Classic Realty Group Prestige
Not available
Estimated sales range
Not available
Not available
| Date | Event | Price |
|---|---|---|
| 6/2/2026 | Price change | $133,300-26.8%$83/sqft |
Source: | ||
| 4/17/2026 | Listed for sale | $182,000+5.8%$114/sqft |
Source: | ||
| 7/31/2025 | Listing removed | $172,000$108/sqft |
Source: | ||
| 7/16/2025 | Listed for sale | $172,000$108/sqft |
Source: | ||
| 6/28/2025 | Listing removed | $172,000$108/sqft |
Source: | ||
| 6/16/2025 | Listed for sale | $172,000+27.4%$108/sqft |
Source: | ||
| 1/17/2022 | Listing removed | -- |
Source: | ||
| 1/13/2022 | Listed for sale | $135,000+200%$84/sqft |
Source: | ||
| 5/6/2018 | Listing removed | $45,000$28/sqft |
Source: 606 Brokers LLC #09822297 Report a problem | ||
| 3/14/2018 | Price change | $45,000-9.8%$28/sqft |
Source: 606 Brokers LLC #09822297 Report a problem | ||
| 12/27/2017 | Listed for sale | $49,900+33.1%$31/sqft |
Source: 606 Brokers LLC #09822297 Report a problem | ||
| 7/1/2017 | Listing removed | $37,500$23/sqft |
Source: Keller Williams Preferred Realty #09354620 Report a problem | ||
| 6/14/2017 | Price change | $37,500-23.3%$23/sqft |
Source: Keller Williams Preferred Realty #09354620 Report a problem | ||
| 11/2/2016 | Price change | $48,900-2.2%$31/sqft |
Source: Keller Williams - Keller Williams Preferred Realty #09354620 Report a problem | ||
| 9/30/2016 | Listed for sale | $50,000-30.1%$31/sqft |
Source: Keller Williams - Keller Williams Preferred Realty #09354620 Report a problem | ||
| 1/11/2016 | Listing removed | $71,500$45/sqft |
Source: Select a Fee RE System #09093162 Report a problem | ||
| 12/4/2015 | Price change | $71,500-18.3%$45/sqft |
Source: Select a Fee RE System #09093162 Report a problem | ||
| 11/28/2015 | Price change | $87,500-1.7%$55/sqft |
Source: Select a Fee RE System #09093162 Report a problem | ||
| 11/7/2015 | Listing removed | $1,700$1/sqft |
Source: Postlets Report a problem | ||
| 11/7/2015 | Price change | $89,000+4.7%$56/sqft |
Source: S & W Realty #09081425 Report a problem | ||
| 10/31/2015 | Listed for rent | $1,700$1/sqft |
Source: Postlets Report a problem | ||
| 10/14/2015 | Listed for sale | $85,000+844.4%$53/sqft |
Source: S & W Realty #09063766 Report a problem | ||
| 1/5/2010 | Sold | $9,000-92.5%$6/sqft |
Source: | ||
| 11/13/2009 | Listed for sale | -- |
Source: foreclosure.com Report a problem | ||
| 12/6/2004 | Sold | $120,000+140%$75/sqft |
Source: Public Record Report a problem | ||
| 7/23/2004 | Sold | $50,000$31/sqft |
Source: Public Record Report a problem | ||
| Year | Property taxes | Tax assessment |
|---|---|---|
| 2024 | -- | $5,300 +21.8% |
| 2023 | $219 +14.1% | $4,353 |
| 2022 | $192 -6.7% | $4,353 |
| 2021 | $206 -68.8% | $4,353 -28.1% |
| 2020 | $658 -0.8% | $6,058 -10% |
| 2019 | $664 +1.9% | $6,732 |
| 2018 | $651 -67.6% | $6,732 -27.9% |
| 2017 | $2,009 +7.5% | $9,331 |
| 2016 | $1,869 +9.3% | $9,331 |
| 2015 | $1,710 +41.8% | $9,331 +43.6% |
| 2014 | $1,206 +2% | $6,500 |
| 2013 | $1,182 -18.4% | $6,500 -19.5% |
| 2012 | $1,449 -18.8% | $8,076 -26.7% |
| 2011 | $1,785 -0.4% | $11,015 |
| 2010 | $1,792 +4.4% | $11,015 |
| 2009 | $1,718 -3.4% | $11,015 -11.1% |
| 2008 | $1,778 +1% | $12,397 |
| 2007 | $1,761 -1.1% | $12,397 |
| 2006 | $1,780 +38.4% | $12,397 +57.6% |
| 2005 | $1,286 +1% | $7,868 |
| 2004 | $1,273 +81.9% | $7,868 |
| 2003 | $700 -5.4% | $7,868 +32.5% |
| 2002 | $740 +9.1% | $5,940 |
| 2001 | $678 +41.5% | $5,940 |
| 2000 | $479 | $5,940 +32.2% |
| 1999 | -- | $4,494 |
Find assessor info on the county website
Source: MRED as distributed by MLS GRID. This data may not be complete. We recommend contacting the local school district to confirm school assignments for this home.
A local agent can set up tours, give advice and negotiate with sellers.