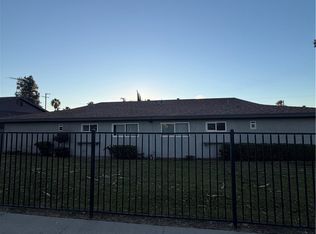
New roof, paint and three units have been remodelled. Prime 4-unit complex in Redlands! 2-story unit features a 1,056 sq. ft., 2 bedroom,1.5 baths. Each unit has their own garage with automatic garage door opener, central heat and wall AC units. Property features on site laundry room and paved parking lot. Close proximity to metro-link station. City of Redlands will allows for 1-2 garage conversions. Excellent investment for new or seasoned real estate investors. Great Rental income. Do not disturb tenants.
For sale
$1,175,000
135 Cook St, Redlands, CA 92374
8beds
--sqft
Multi Family
Built in 1964
-- sqft lot
$1,174,200 Zestimate®
$--/sqft
$-- HOA
What's special
Paved parking lotCentral heatOn site laundry roomWall ac units
- 22 days
- 430
- 30
Likely to sell faster than
Zillow last checked:
Listing updated:
Listed by:
Alex Avelar DRE #01935564 760-497-4132,
Cielo Home Group
Source: SDMLS,MLS#: 260024557 Originating MLS: SDMLS
Facts & features
Interior
Bedrooms & bathrooms
- Bedrooms: 8
- Bathrooms: 8
- Full bathrooms: 4
- 1/2 bathrooms: 4
Cooling
- Wall/Window
Interior area
- Total structure area: 4,224
Property
Features
- Levels: 2 Story
- Fencing: Other/Remarks
Lot
- Size: 0.29 Acres
Details
- Parcel number: 0170251380000
- Special conditions: Call Agent
Construction
Type & style
- Home type: MultiFamily
- Property subtype: Multi Family
Materials
- Wood/Stucco
- Roof: Composition
Condition
- Year built: 1964
Community & HOA
Community
- Security: N/K
- Subdivision: Other(OTHR)
Location
- Region: Redlands
Financial & listing details
- Tax assessed value: $1,059,052
- Date on market: 10/9/2026
- Listing terms: Cash,Conventional
- Tenant pays: Cable TV, Electricity, Gas/Propane
Estimated market value
$1,174,200
$1.12M - $1.23M
$2,180/mo
Price history
| Date | Event | Price |
|---|---|---|
| 10/9/2026 | Listed for sale | $1,175,000-4.1% |
Source:  SDMLS #260024557 Report a problem | ||
| 8/13/2025 | Listing removed | $1,225,000 |
Source: SDMLS #240028440 Report a problem | ||
| 4/21/2025 | Contingent | $1,225,000 |
Source: SDMLS #240028440 Report a problem | ||
| 12/13/2024 | Listed for sale | $1,225,000+25.2% |
Source: SDMLS #240028440 Report a problem | ||
| 7/23/2021 | Sold | $978,500+3% |
Source: Public Record Report a problem | ||
| 6/8/2021 | Contingent | $950,000 |
Source:  CRMLS #CV21096311 Report a problem | ||
| 6/8/2021 | Pending sale | $950,000+229.9% |
Source: CRMLS #CV21121325 Report a problem | ||
| 2/24/2021 | Listing removed | -- |
Source: Owner Report a problem | ||
| 6/20/2020 | Listing removed | $1,400 |
Source: Owner Report a problem | ||
| 6/12/2020 | Listed for rent | $1,400-6.7% |
Source: Owner Report a problem | ||
| 12/19/2019 | Listing removed | $1,500 |
Source: Owner Report a problem | ||
| 11/16/2019 | Listed for rent | $1,500 |
Source: Owner Report a problem | ||
| 9/1/2019 | Listing removed | $1,500 |
Source: Owner Report a problem | ||
| 8/27/2019 | Listed for rent | $1,500+7.1% |
Source: Owner Report a problem | ||
| 3/13/2019 | Listing removed | $1,400 |
Source: Owner Report a problem | ||
| 1/21/2019 | Listed for rent | $1,400 |
Source: Owner Report a problem | ||
| 8/11/2010 | Sold | $288,000+16.8% |
Source: Public Record Report a problem | ||
| 10/7/2009 | Sold | $246,500-61.4% |
Source: Public Record Report a problem | ||
| 12/12/2006 | Sold | $639,000+132.4% |
Source: Public Record Report a problem | ||
| 5/11/1999 | Sold | $275,000+2015.4% |
Source: Public Record Report a problem | ||
| 9/6/1996 | Sold | $13,000 |
Source: Public Record Report a problem | ||
Public tax history
| Year | Property taxes | Tax assessment |
|---|---|---|
| 2026 | -- | $1,059,052 +2% |
| 2025 | $12,940 +7.1% | $1,038,286 +2% |
| 2024 | $12,082 +0.1% | $1,017,927 +2% |
| 2023 | $12,068 +1.5% | $997,968 +2% |
| 2022 | $11,894 +171.3% | $978,400 +187% |
| 2021 | $4,384 +1.5% | $340,878 +1% |
| 2020 | $4,320 +2.8% | $337,383 +2% |
| 2019 | $4,202 +2.5% | $330,768 +2% |
| 2018 | $4,099 +0.8% | $324,283 +2% |
| 2017 | $4,065 | $317,924 +2% |
| 2016 | $4,065 +1.1% | $311,690 +1.5% |
| 2015 | $4,021 +0.7% | $307,009 +2% |
| 2014 | $3,991 | $300,995 +0.5% |
| 2013 | -- | $299,635 +2% |
| 2012 | -- | $293,760 +2% |
| 2011 | -- | $288,000 -7.1% |
| 2010 | -- | $310,000 -53.4% |
| 2009 | -- | $664,712 +2% |
| 2008 | -- | $651,678 +2% |
| 2007 | -- | $638,900 +102.5% |
| 2006 | -- | $315,476 +2% |
| 2005 | -- | $309,290 +2% |
| 2004 | -- | $303,226 +1.9% |
| 2003 | -- | $297,668 +2% |
| 2002 | -- | $291,832 +2% |
| 2001 | -- | $286,110 +2% |
| 2000 | -- | $280,500 |
Find assessor info on the county website
Monthly payment
Est. payment
Payment breakdown
Explore the cost of this home by adjusting the details. Changes won't be saved.Climate risks
Neighborhood: 92374


Similar homes
- $1,250,0008 bd-- ba4.3k sqft1007 Lombard Dr, Redlands, CA 92374For Sale
 MLS ID #IG26222570, Cristian Camargo, Realty ONE Group Homelink. CRMLS
- $1,100,0007 bd6 ba2.7k sqft1318 Stillman Ave, Redlands, CA 92374New Construction
 MLS ID #IG26231502, Brandon Rivinius, RELIABLE REALTY GROUP, INC.. CRMLS
- $1,300,0008 bd4 ba3.4k sqft10952 Rincon St, Loma Linda, CA 92354For Sale
 MLS ID #PW26176694, Vince Lacambra, Cochran Real Estate Professionals Inc. CRMLS
- $1,097,0005 bd3 ba2.4k sqft25612 Lane St, Loma Linda, CA 92354For Sale
 MLS ID #IG26207199, Joseph Shaw, Shaw Real Estate Brokers. CRMLS
