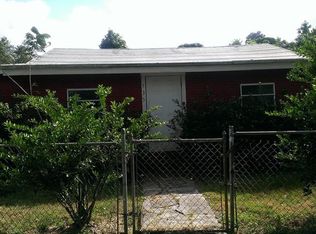
This 900 square foot single family home has 3 bedrooms and 1.0 bathrooms. This home is located at 135 Smith St, Bowling Green, FL 33860.
Pre-foreclosure
Est. $195,600
135 Smith St, Bowling Green, FL 33860
3beds
1baths
900sqft
SingleFamily
Built in 1956
5,183 Square Feet Lot
$195,600 Zestimate®
$217/sqft
$-- HOA
Overview
- 115 days
- 5
- 0
Facts & features
Interior
Bedrooms & bathrooms
- Bedrooms: 3
- Bathrooms: 1
Heating
- None
Cooling
- None
Appliances
- Included: Microwave, Refrigerator
Features
- Flooring: Carpet
- Has fireplace: No
Interior area
- Total interior livable area: 900 sqft
Property
Parking
- Parking features: None
Features
- Exterior features: Stucco
Lot
- Size: 5,183 Square Feet
Details
- Parcel number: 233112159500004010
Construction
Type & style
- Home type: SingleFamily
Materials
- Frame
- Foundation: Piers
- Roof: Metal
Condition
- Year built: 1956
Community & HOA
Location
- Region: Bowling Green
Financial & listing details
- Price per square foot: $217/sqft
- Tax assessed value: $125,743
- Annual tax amount: $1,144
Foreclosure details
Estimated market value
$195,600
$184,000 - $207,000
$1,486/mo
Price history
| Date | Event | Price |
|---|---|---|
| 9/22/2023 | Sold | $200,000+104.1%$222/sqft |
Source: Public Record Report a problem | ||
| 8/25/2023 | Listing removed | -- |
Source: Stellar MLS #T3466218 Report a problem | ||
| 8/15/2023 | Listed for rent | $1,650$2/sqft |
Source: Stellar MLS #T3466218 Report a problem | ||
| 10/6/2022 | Sold | $98,000+889.9%$109/sqft |
Source: Public Record Report a problem | ||
| 2/16/2016 | Sold | $9,900+20.7%$11/sqft |
Source: Public Record Report a problem | ||
| 11/13/2014 | Sold | $8,200$9/sqft |
Source: Public Record Report a problem | ||
Public tax history
| Year | Property taxes | Tax assessment |
|---|---|---|
| 2025 | $1,144 -3.7% | $125,743 -2.1% |
| 2024 | $1,188 +16.6% | $128,500 +71.7% |
| 2023 | $1,019 +44.2% | $74,819 +82% |
| 2022 | $706 +23.9% | $41,114 +10% |
| 2021 | $570 +11.8% | $37,376 +10% |
| 2020 | $510 +7.6% | $33,978 +10% |
| 2019 | $474 -45.9% | $30,889 -4.4% |
| 2018 | $877 +5.7% | $32,307 +26.6% |
| 2017 | $829 +118.3% | $25,528 +2.7% |
| 2016 | $380 -0.4% | $24,859 +2% |
| 2015 | $382 -44.2% | $24,381 -2.3% |
| 2014 | $684 +54.2% | $24,960 -9.9% |
| 2013 | $444 | $27,692 +27.3% |
| 2012 | -- | $21,756 +3% |
| 2011 | -- | $21,122 +1.5% |
| 2010 | -- | $20,810 +2.7% |
| 2009 | -- | $20,263 +0.1% |
| 2008 | -- | $20,243 |
| 2007 | -- | -- |
| 2006 | -- | -- |
| 2005 | -- | -- |
| 2004 | -- | -- |
| 2003 | -- | $16,499 +4.9% |
| 2002 | -- | $15,734 +1.6% |
| 2001 | -- | $15,486 |
Find assessor info on the county website