Commuter’s dream in North Quincy! This bright and spacious 8-room, 3-bedroom, 2-bathroom single-family home offers comfort and exceptional convenience. The well-appointed kitchen features granite countertops, stainless steel appliances, and gas cooking. Unwind in the generous living room centered around a classic fireplace, complemented by gleaming hardwood floors and recessed lighting throughout. Key modern amenities include central A/C, efficient gas heat, updated windows, and two full bathrooms. Downstairs, the basement offers laundry and excellent storage potential, while outside you will find a private fenced-in backyard and private driveway parking. Superbly located just minutes to the North Quincy T Station (Red Line) and I-93 for a seamless Boston commute, with Wollaston Beach, parks, dining, and shopping in Quincy all nearby.
For sale
Price cut: $10.1K (10/7)
$749,900
136 W Squantum St, Quincy, MA 02171
3beds
1,618sqft
Single Family Residence
Built in 1945
3,825 Square Feet Lot
$736,600 Zestimate®
$463/sqft
$-- HOA
What's special
Classic fireplaceEfficient gas heatPrivate fenced-in backyardWell-appointed kitchenGleaming hardwood floorsGranite countertopsRecessed lighting throughout
- 34 days
- 2,897
- 194
Likely to sell faster than
Zillow last checked:
Listing updated:
Listed by:
Zachary Chapline,
Round Room 617-487-8082
Source: MLS PIN,MLS#: 73578888
Facts & features
Interior
Bedrooms & bathrooms
- Bedrooms: 3
- Bathrooms: 2
- Full bathrooms: 2
Heating
- Forced Air, Natural Gas
Cooling
- Central Air
Appliances
- Included: Gas Water Heater, Range, Dishwasher, Refrigerator
Features
- Flooring: Tile, Hardwood
- Basement: Finished
- Number of fireplaces: 1
Interior area
- Total structure area: 1,618
- Total interior livable area: 1,618 sqft
- Finished area above ground: 922
- Finished area below ground: 696
Property
Parking
- Total spaces: 3
- Parking features: Paved Drive, Off Street
- Uncovered spaces: 3
Features
- Waterfront features: 1 to 2 Mile To Beach
Lot
- Size: 3,825 Square Feet
Details
- Parcel number: 194679
- Zoning: RESA
Construction
Type & style
- Home type: SingleFamily
- Architectural style: Ranch
- Property subtype: Single Family Residence
Materials
- Frame
- Foundation: Concrete Perimeter
Condition
- Year built: 1945
Utilities & green energy
- Electric: Circuit Breakers
- Sewer: Public Sewer
- Water: Public
- Utilities for property: for Gas Range
Community & HOA
Community
- Features: Public Transportation, Public School, T-Station
HOA
- Has HOA: No
Location
- Region: Quincy
Financial & listing details
- Price per square foot: $463/sqft
- Tax assessed value: $604,200
- Annual tax amount: $7,117
- Date on market: 9/17/2026
Estimated market value
$736,600
$700,000 - $773,000
$3,366/mo
Price history
| Date | Event | Price |
|---|---|---|
| 10/7/2026 | Price change | $749,900-1.3%$463/sqft |
Source: MLS PIN #73578888 Report a problem | ||
| 9/17/2026 | Listed for sale | $760,000+31.7%$470/sqft |
Source: MLS PIN #73578888 Report a problem | ||
| 7/28/2025 | Listing removed | $3,600$2/sqft |
Source: Zillow Rentals Report a problem | ||
| 7/22/2025 | Price change | $3,600-5.3%$2/sqft |
Source: Zillow Rentals Report a problem | ||
| 7/7/2025 | Listed for rent | $3,800+11.8%$2/sqft |
Source: Zillow Rentals Report a problem | ||
| 6/1/2023 | Listing removed | -- |
Source: Zillow Rentals Report a problem | ||
| 5/30/2023 | Listed for rent | $3,400+6.3%$2/sqft |
Source: Zillow Rentals Report a problem | ||
| 8/16/2022 | Listing removed | -- |
Source: Zillow Rental Manager Report a problem | ||
| 8/9/2022 | Listed for rent | $3,200$2/sqft |
Source: Zillow Rental Manager Report a problem | ||
| 7/2/2018 | Sold | $577,008-2%$357/sqft |
Source: Public Record Report a problem | ||
| 5/8/2018 | Price change | $589,000-1.8%$364/sqft |
Source: V & E Realty #72308920 Report a problem | ||
| 4/14/2018 | Listed for sale | $599,900+71.4%$371/sqft |
Source: V & E Realty #72308920 Report a problem | ||
| 10/16/2017 | Sold | $350,000+3.6%$216/sqft |
Source: Public Record Report a problem | ||
| 9/7/2017 | Listed for sale | $338,000+231.4%$209/sqft |
Source: Denkar Realty Group #72224394 Report a problem | ||
| 6/22/1993 | Sold | $102,000$63/sqft |
Source: Public Record Report a problem | ||
Public tax history
| Year | Property taxes | Tax assessment |
|---|---|---|
| 2025 | $6,513 +2.7% | $564,900 +0.4% |
| 2024 | $6,339 +5% | $562,500 +3.7% |
| 2023 | $6,039 +1.9% | $542,600 +9.6% |
| 2022 | $5,929 +9.8% | $494,900 +11.3% |
| 2021 | $5,399 +2.4% | $444,700 +4.8% |
| 2020 | $5,274 +3.5% | $424,300 +4.5% |
| 2019 | $5,094 +24.2% | $405,900 +32% |
| 2018 | $4,101 +1.2% | $307,400 +7.5% |
| 2017 | $4,051 +10.5% | $285,900 +12% |
| 2016 | $3,666 +8% | $255,300 +9.8% |
| 2015 | $3,396 +4% | $232,600 +5.8% |
| 2014 | $3,266 +1.4% | $219,800 -1% |
| 2013 | $3,220 +4.3% | $222,100 -1% |
| 2012 | $3,086 +2.1% | $224,400 -0.4% |
| 2011 | $3,024 +0.9% | $225,300 -0.6% |
| 2010 | $2,997 -2.1% | $226,700 -6.7% |
| 2009 | $3,061 +6.4% | $242,900 -8.5% |
| 2008 | $2,876 +8.2% | $265,600 +4.3% |
| 2007 | $2,658 +3.7% | $254,600 +2.6% |
| 2006 | $2,564 -3.9% | $248,200 +0.9% |
| 2005 | $2,667 +2.2% | $246,000 +18.4% |
| 2004 | $2,610 +21.2% | $207,800 +31.4% |
| 2003 | $2,153 +29.2% | $158,100 +51.1% |
| 2001 | $1,667 +4.6% | $104,600 |
| 1999 | $1,594 | $104,600 |
Find assessor info on the county website
Monthly payment
Est. payment
Payment breakdown
Explore the cost of this home by adjusting the details. Changes won't be saved.Climate risks
Neighborhood: Montclair


Similar homes
- $774,9003 bd2 ba2.1k sqft10 Kardon Rd, Hyde Park, MA 02136For Sale
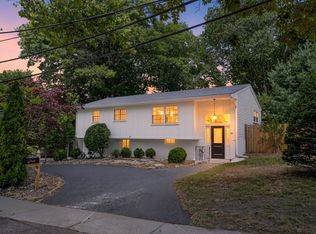 MLS ID #73564778, Sabbor Sheikh Team, Coldwell Banker Realty - Boston. MLS PIN
- $774,0003 bd2 ba1.7k sqft545 Washington St, Braintree, MA 02184For Sale
 MLS ID #73567793, Anh Nguyen, Serhant. MLS PIN
- $645,9003 bd2 ba1.9k sqft334 Sea St, Quincy, MA 02169For Sale
 MLS ID #73577409, Zhonghui Zhu, Keller Williams Realty. MLS PIN
- $700,0004 bd3 ba1.8k sqft112 Stoughton St, Quincy, MA 02169For Sale
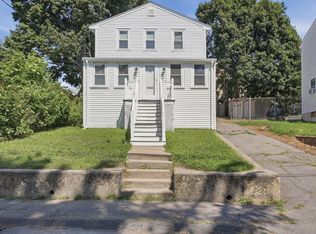 MLS ID #73565026, Nicole Vermillion, Lamacchia Realty, Inc.. MLS PIN
