looking for a great alternative condo living? This one bedroom single family home off the comfort and privacy of a single family residence, complete with central air conditioning, force hot air, with gas fireplace for year-round comfort. Enjoy great outdoor space, perfect for entertaining. Conveniently located near shopping, restaurants and major highways. This home was completely updated in 2018. Don't miss this opportunity to make this cozy home your home.
Active
$295,000
146 Oakland Ave, Pawtucket, RI 02861
1beds
468sqft
Single Family Residence
Built in 1930
3,824 Square Feet Lot
$293,400 Zestimate®
$630/sqft
$-- HOA
What's special
Central air conditioning
- 3 days
- 281
- 23
Zillow last checked:
Listing updated:
Listed by:
Michael Anselmo 401-340-9558,
LPT Realty
Source: StateWide MLS RI,MLS#: 1426597
Facts & features
Interior
Bedrooms & bathrooms
- Bedrooms: 1
- Bathrooms: 1
- Full bathrooms: 1
Heating
- Natural Gas, Central Air, Forced Air
Cooling
- Central Air
Appliances
- Included: Gas Water Heater
Features
- Flooring: Hardwood
- Basement: Full,Bulkhead,Partially Finished
- Number of fireplaces: 1
- Fireplace features: Free Standing
Interior area
- Total structure area: 468
- Total interior livable area: 468 sqft
- Finished area above ground: 468
- Finished area below ground: 0
Property
Parking
- Total spaces: 2
- Parking features: No Garage
Lot
- Size: 3,824 Square Feet
Details
- Parcel number: PAWTM11L0745
Construction
Type & style
- Home type: SingleFamily
- Architectural style: Ranch
- Property subtype: Single Family Residence
Materials
- Vinyl Siding
- Foundation: Concrete Perimeter
Condition
- New construction: No
- Year built: 1930
Utilities & green energy
- Electric: 100 Amp Service
- Utilities for property: Sewer Connected, Water Connected
Community & HOA
HOA
- Has HOA: No
Location
- Region: Pawtucket
Financial & listing details
- Price per square foot: $630/sqft
- Tax assessed value: $241,800
- Annual tax amount: $3,169
- Date on market: 10/21/2026
Estimated market value
$293,400
$279,000 - $308,000
$1,456/mo
Price history
| Date | Event | Price |
|---|---|---|
| 10/21/2026 | Listed for sale | $295,000+96.8%$630/sqft |
Source:  StateWide MLS RI #1426597 Report a problem | ||
| 6/4/2018 | Sold | $149,900+24.7%$320/sqft |
Source: StateWide MLS RI #1189593 Report a problem | ||
| 10/22/2014 | Sold | $120,228+170.2%$257/sqft |
Source: Public Record Report a problem | ||
| 9/15/2014 | Listed for sale | $44,500+2608.5%$95/sqft |
Source: RE/MAX Town and Country #1078769 Report a problem | ||
| 1/10/2013 | Sold | $1,643-96.8%$4/sqft |
Source: Public Record Report a problem | ||
| 1/14/2000 | Sold | $51,000+10.9%$109/sqft |
Source: Public Record Report a problem | ||
| 8/27/1994 | Sold | $46,000$98/sqft |
Source: Public Record Report a problem | ||
Public tax history
| Year | Property taxes | Tax assessment |
|---|---|---|
| 2025 | $2,984 | $241,800 |
| 2024 | $2,984 +14.4% | $241,800 +53.7% |
| 2023 | $2,608 | $157,300 |
| 2022 | $2,608 | $157,300 |
| 2021 | $2,608 +7.9% | $157,300 +36% |
| 2020 | $2,417 | $115,700 |
| 2019 | $2,417 +3.8% | $115,700 |
| 2018 | $2,329 +26.4% | $115,700 +42.7% |
| 2017 | $1,843 +3.8% | $81,100 |
| 2016 | $1,775 | $81,100 |
| 2015 | $1,775 +1.3% | $81,100 +6.7% |
| 2014 | $1,753 | $76,000 |
| 2013 | $1,753 | $76,000 +900% |
| 2012 | $1,753 -11.4% | $7,600 -93.2% |
| 2011 | $1,979 | $111,300 |
| 2010 | $1,979 | $111,300 |
| 2009 | $1,979 +12.8% | $111,300 -21.4% |
| 2008 | $1,754 +4.5% | $141,600 |
| 2007 | $1,679 +20% | $141,600 +81.3% |
| 2005 | $1,399 +3.9% | $78,100 |
| 2004 | $1,347 +3.9% | $78,100 |
| 2003 | $1,296 | $78,100 |
Find assessor info on the county website
Monthly payment
Est. payment
Payment breakdown
Explore the cost of this home by adjusting the details. Changes won't be saved.Climate risks
Neighborhood: Pine Crest


Similar homes
- $289,9001 bd1 ba528 sqftParkside Condominiums, Providence, RI 02906For Sale
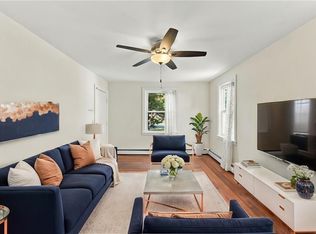
 MLS ID #1421926, The Rachel Jones Team, SKD Real Estate. StateWide MLS RI
- $269,0001 bd1 ba606 sqftLofts At The Strand, Providence, RI 02903For Sale
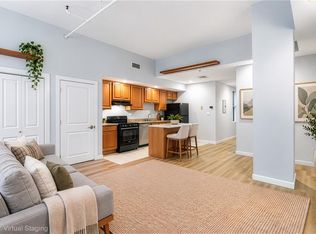 MLS ID #1425000, Alysandra Nemeth, Redfin Corporation. StateWide MLS RI
- $289,0001 bd1 ba600 sqftCrows Nest, Bristol, RI 02809For Sale
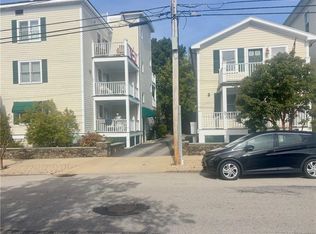 MLS ID #1426498, Karen Florio, William Raveis Inspire. StateWide MLS RI
- $329,0001 bd1 ba560 sqft86 Oakside St, Warwick, RI 02889For Sale
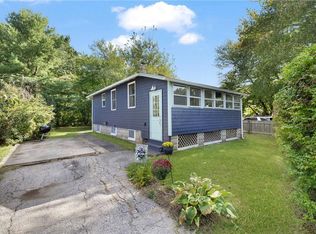 MLS ID #1424169, Jeff St. Germain, Keller Williams Coastal. StateWide MLS RI
- $329,9001 bd2 ba698 sqftThe J.C. Hovey House, Providence, RI 02906For SaleMLS ID #1422497, Victoria Calabro, JPAR Prime Real Estate. StateWide MLS RI
- $289,0001 bd1 ba587 sqftSutton Place Condo Association, Providence, RI 02903For SaleMLS ID #1420420, Denise Mancini, Coldwell Banker Realty. StateWide MLS RI
- $269,900-- bd1 ba700 sqftKirby House Condo, Providence, RI 02909For SaleMLS ID #1425855, Joseph Pytka, RE/MAX ONE. StateWide MLS RI
- $319,0001 bd1 ba581 sqftArcade Providence Residences, Providence, RI 02903For SaleMLS ID #1422696, Meagan Leal, Residential Properties Ltd.. StateWide MLS RI
- $169,9002 bd1 ba628 sqft29 W Budlong Farm Rd, Warwick, RI 02886For SaleMLS ID #1426451, Izabella Whiting, RE/MAX Real Estate Center. StateWide MLS RI
- $424,999-- bd1 ba500 sqft215 Waterman Ave, East Providence, RI 02914For SaleMLS ID #1424205, Sara Fernandes, HERE Realty. StateWide MLS RI
- $349,9003 bd1 ba650 sqftLincoln Ave Condos, Bristol, RI 02809For SaleMLS ID #1426635, Matthew Marciano, BHHS Commonwealth Real Estate. StateWide MLS RI
- $325,0001 bd1 ba483 sqft225 Weybosset St Condos, Providence, RI 02903For SaleMLS ID #1413022, The Homestead Group, Residential Properties Ltd.. StateWide MLS RI
- $239,9001 bd1 ba624 sqftOcean Forty, Warwick, RI 02886For SaleMLS ID #1425682, Delia Buffington, Century 21 Limitless. StateWide MLS RI
- $239,9001 bd1 ba685 sqftWestgate Condominiums, Warwick, RI 02818For SaleMLS ID #1425892, Tracy Mansolillo, REMAX Revolution. StateWide MLS RI
- $269,9001 bd1 ba588 sqftGeneva Mills, North Providence, RI 02904For SaleMLS ID #1417141, David Zuller, Westcott Properties. StateWide MLS RI
- $349,9002 bd1 ba616 sqft103 Darrow Dr, Warwick, RI 02886For SaleMLS ID #1423835, Gayle Moone, Real Estate Masters, Inc.. StateWide MLS RI
- $329,0001 bd1 ba675 sqftArcade Providence Residences, Providence, RI 02903For SaleMLS ID #1419655, Sara Chaffee-Standish, Mott & Chace Sotheby's Intl.. StateWide MLS RI
