CALLING ALL DEVELOPERS, RM15 ZONING up to 4 townhomes, buyer to verify. This pool home has a total of 2018 sq. feet under roof and 1,586 under air situated on a 12,345 sq. foot lot zoned multifamily. Mature palm trees and mature landscaping complement this beautiful lot. The home needs an extremely handy buyer or DEVELOPER to bring it back to its glory. Located on a quiet tree lined street in Middle River Terrace, this home is close distance to Wilton Drive and Wilton Manors and the revitalized 13th Street area with new restaurants and businesses. Buyer to verify square footage and perform buyer inspections. Use showing time please. CASH BUYER. Listing agent must be present at showings.
Foreclosed
Est. $666,500
1521 NE 5th Ter, Fort Lauderdale, FL 33304
3beds
1,586sqft
SingleFamily
Built in 1956
0.28 Acres Lot
$666,500 Zestimate®
$420/sqft
$-- HOA
Overview
- 226 days
- 43
- 1
Facts & features
Interior
Bedrooms & bathrooms
- Bedrooms: 3
- Bathrooms: 2
- Full bathrooms: 2
Heating
- Forced air
Cooling
- Central
Appliances
- Included: Dishwasher, Dryer, Microwave, Range / Oven, Refrigerator, Washer
Features
- Flooring: Tile
Interior area
- Total interior livable area: 1,586 sqft
Property
Parking
- Total spaces: 1
- Parking features: Garage - Attached, Garage - Detached
Features
- Exterior features: Stucco, Cement / Concrete
Lot
- Size: 0.28 Acres
Details
- Parcel number: 494234270091
Construction
Type & style
- Home type: SingleFamily
Materials
- masonry
- Foundation: Other
- Roof: Shake / Shingle
Condition
- Year built: 1956
Community & HOA
Location
- Region: Fort Lauderdale
Financial & listing details
- Price per square foot: $420/sqft
- Tax assessed value: $583,770
- Annual tax amount: $11,493
Foreclosure details
Estimated market value
$666,500
$633,000 - $700,000
$4,938/mo
Price history
| Date | Event | Price |
|---|---|---|
| 8/19/2026 | Listing removed | $694,900$438/sqft |
Source:  MIAMI #A12043502 Report a problem | ||
| 8/13/2026 | Listed for sale | $694,900$438/sqft |
Source: MIAMI #A12043502 Report a problem | ||
| 7/14/2026 | Listing removed | $694,900$438/sqft |
Source: MIAMI #A12043502 Report a problem | ||
| 6/25/2026 | Listed for sale | $694,900+131.6%$438/sqft |
Source: MIAMI #A12043502 Report a problem | ||
| 4/1/2026 | Sold | $300,100-62.4%$189/sqft |
Source: Public Record Report a problem | ||
| 7/17/2025 | Price change | $798,000+14.3%$503/sqft |
Source:  BeachesMLS #RX-11067299 Report a problem | ||
| 5/6/2025 | Price change | $698,000-6.9%$440/sqft |
Source: BeachesMLS #RX-11067299 Report a problem | ||
| 3/2/2025 | Listed for sale | $750,000+7.3%$473/sqft |
Source: BeachesMLS #RX-11067299 Report a problem | ||
| 8/1/2024 | Listing removed | -- |
Source: MIAMI #A11573944 Report a problem | ||
| 7/26/2024 | Listed for sale | $699,000$441/sqft |
Source: MIAMI #A11573944 Report a problem | ||
| 7/16/2024 | Pending sale | $699,000$441/sqft |
Source: MIAMI #A11573944 Report a problem | ||
| 6/15/2024 | Price change | $699,000-5.4%$441/sqft |
Source: MIAMI #A11573944 Report a problem | ||
| 4/22/2024 | Listed for sale | $739,000-1.3%$466/sqft |
Source: MIAMI #A11573944 Report a problem | ||
| 4/22/2024 | Listing removed | -- |
Source: MIAMI #A11529102 Report a problem | ||
| 3/13/2024 | Price change | $749,000-13.7%$472/sqft |
Source: MIAMI #A11529102 Report a problem | ||
| 3/2/2024 | Price change | $868,000-0.1%$547/sqft |
Source: MIAMI #A11529102 Report a problem | ||
| 2/7/2024 | Listed for sale | $869,000-8.4%$548/sqft |
Source: MIAMI #A11529102 Report a problem | ||
| 2/1/2024 | Listing removed | -- |
Source: MIAMI #A11501101 Report a problem | ||
| 2/1/2024 | Price change | $949,000-1.1%$598/sqft |
Source: MIAMI #A11501101 Report a problem | ||
| 1/24/2024 | Price change | $960,000-1%$605/sqft |
Source: MIAMI #A11501101 Report a problem | ||
| 1/9/2024 | Price change | $970,000-0.5%$612/sqft |
Source: MIAMI #A11501101 Report a problem | ||
| 12/14/2023 | Listed for sale | $975,000+62.5%$615/sqft |
Source: MIAMI #A11501101 Report a problem | ||
| 7/27/2023 | Sold | $600,000-14%$378/sqft |
Source: BeachesMLS #F10383970 Report a problem | ||
| 6/26/2023 | Contingent | $698,000+293.2%$440/sqft |
Source: BeachesMLS #F10383970 Report a problem | ||
| 3/8/2013 | Sold | $177,500-47.8%$112/sqft |
Source: Public Record Report a problem | ||
| 6/22/2004 | Sold | $340,000+87.3%$214/sqft |
Source: Public Record Report a problem | ||
| 7/29/2002 | Sold | $181,500+19%$114/sqft |
Source: Public Record Report a problem | ||
| 3/21/2002 | Sold | $152,500+52.5%$96/sqft |
Source: Public Record Report a problem | ||
| 8/23/1994 | Sold | $100,000$63/sqft |
Source: Public Record Report a problem | ||
Public tax history
| Year | Property taxes | Tax assessment |
|---|---|---|
| 2025 | $11,493 +10.3% | $579,240 +10% |
| 2024 | $10,419 +206.6% | $526,590 +179% |
| 2023 | $3,398 +6.2% | $188,730 +3% |
| 2022 | $3,201 +3.1% | $183,240 +3% |
| 2021 | $3,103 +1.9% | $177,910 +1.4% |
| 2020 | $3,047 +11.3% | $175,460 +2.3% |
| 2019 | $2,738 | $171,520 +1.9% |
| 2018 | $2,738 +6.8% | $168,330 +2.1% |
| 2017 | $2,564 -18.2% | $164,870 +2.1% |
| 2016 | $3,134 +22.8% | $161,480 +0.7% |
| 2015 | $2,553 -0.7% | $160,360 +0.8% |
| 2014 | $2,571 -0.7% | $159,090 -0.6% |
| 2013 | $2,590 -6.9% | $159,970 -7.1% |
| 2012 | $2,783 -8.4% | $172,120 -7.1% |
| 2011 | $3,038 -33% | $185,330 -27.4% |
| 2010 | $4,536 -14.5% | $255,120 -15.2% |
| 2009 | $5,306 -12.7% | $301,000 -12% |
| 2008 | $6,079 -1.7% | $342,010 +3% |
| 2007 | $6,181 -7.3% | $332,050 +2.5% |
| 2006 | $6,669 | $323,960 +3% |
| 2005 | -- | $314,530 +107.5% |
| 2004 | $3,220 +4.3% | $151,570 +1.9% |
| 2003 | $3,086 +21.1% | $148,750 +48.7% |
| 2002 | $2,549 +3.5% | $100,040 +3.4% |
| 2001 | $2,464 +59.5% | $96,760 |
| 2000 | $1,545 | -- |
Find assessor info on the county website
Monthly payment
Climate risks
Neighborhood: Middle River Terrace
- $624,9003 bd3 ba1.4k sqft1525 NE 5th Ter, Fort Lauderdale, FL 33304Off Market
- $299,2001 bd1 ba700 sqft1517 NE 5th Ter, Fort Lauderdale, FL 33304Off Market

- $186,4001 bd1 ba650 sqft1517 NE 5th Ter APT 4, Fort Lauderdale, FL 33304Off Market
- $--1 bd1 ba700 sqft1517 NE 5th Ter APT 1, Fort Lauderdale, FL 33304Off Market

Similar homes
- $569,0004 bd2 ba1.1k sqftMiddle River Terrace Amd, Fort Lauderdale, FL 33305For Sale

 MLS ID #A12029529, Wesly Blanc, Lifestyle International Realty. MIAMI
- $687,0003 bd2 ba1.4k sqftJenada Villas, Fort Lauderdale, FL 33311For Sale
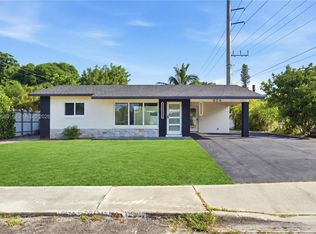 MLS ID #A12080589, Ofelia Fern Di Bella, Fern & Associate Realty. MIAMI
- $749,0003 bd3 ba1.5k sqftCoral Ridge Add, Fort Lauderdale, FL 33334For Sale
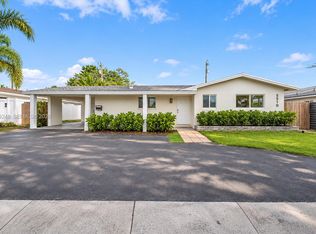 MLS ID #A12119248, Laura Franco Castano, Avanti Way Brickell. MIAMI
- $649,0003 bd2 ba1.7k sqftJacaranda Heights, Fort Lauderdale, FL 33312For Sale
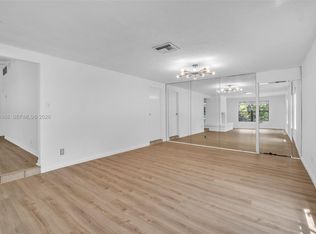 MLS ID #A12040368, Emily Yahav, Coast. MIAMI
- $599,4003 bd2 ba1.3k sqftMelrose Manor, Fort Lauderdale, FL 33312For SaleMLS ID #A12067882, Beatriz Penate, Bluesage Realty. MIAMI
- $450,0003 bd2 ba1.6k sqftLauderdale Villas, Fort Lauderdale, FL 33311For SaleMLS ID #A12073136, Maria Hadra, The Keyes Company - Miramar. MIAMI
- $429,5002 bd1 ba858 sqftProgresso, Fort Lauderdale, FL 33304For SaleMLS ID #A11960387, Kimberly Mcintosh, LoKation. MIAMI
- $765,0003 bd2 ba1.2k sqftBabco Heights, Fort Lauderdale, FL 33311For SaleMLS ID #A12020364, Priscilla Brown, Gulfstream Real Estate Solutio. MIAMI
- $435,0003 bd2 ba1.1k sqftProgresso, Fort Lauderdale, FL 33311For SaleMLS ID #A12080403, Arthur Bartholomew, Walnut Street Realty Co. MIAMI
- $675,0003 bd2 ba1.4k sqft1844 Sheridan Street, Hollywood, FL 33020For Sale
 MLS ID #B26045113, Kar Wai Chu, LoKation. BeachesMLS
- $409,0003 bd2 ba972 sqftProgresso, Fort Lauderdale, FL 33311For SaleMLS ID #A12080515, Arthur Bartholomew, Walnut Street Realty Co. MIAMI
- $799,0003 bd4 ba2k sqftReed Land Co, Fort Lauderdale, FL 33312For SaleMLS ID #A12110672, Yoseph Madar, Miami Lifestyle Realty Inc. MIAMI
- $450,0003 bd1 ba941 sqftLauderdale Manors Add-Res, Fort Lauderdale, FL 33311For SaleMLS ID #A12108599, Shelby Salgado Hernandez, Keller Williams Realty International Lifestyles. MIAMI
- $745,0003 bd2 ba1.7k sqftPlantations Secluded Gard, Fort Lauderdale, FL 33317For SaleMLS ID #A12045980, Jorge Safont, United Realty Group Inc. MIAMI
- $649,9003 bd3 ba1.4k sqftHollywood Terrace, Hollywood, FL 33020For SaleMLS ID #A12089414, Andres Barboza, Florida Realty of Miami Corp. MIAMI
- $639,0003 bd2 ba1.3k sqftLakeview Heights No 2, Hollywood, FL 33021For SaleMLS ID #A11984870, Lidia Mara, Best Invest Florida Realty LLC. MIAMI
- $451,0004 bd2 ba1.5k sqft517 NW 16th Avenue, Fort Lauderdale, FL 33311For SaleMLS ID #B26072860, Minnie D June, Enhanced Realty, PA. BeachesMLS
- $699,0003 bd2 ba1.9k sqftHollywood Hills, Hollywood, FL 33021For SaleMLS ID #A12102383, Laura Zelnick, LoKation. MIAMI
- $619,0004 bd2 ba1.5k sqftPark Road Manor, Hollywood, FL 33021For SaleMLS ID #A12105392, Valeria Rougier, VR Realty Group PA. MIAMI
- $635,0003 bd3 ba1.5k sqftU S Lend Lease Plat No On, Dania, FL 33004For SaleMLS ID #A12025262, Jorge Brandt, United Realty Group Inc. MIAMI
