Great home for a weekend getaway. Less than 5 minutes walking distance to the boat launch and swimming area. It is perfect for a retired couple or family getaway looking for a place to fish and enjoy the lake. Furniture is included, just bring your clothes and boat. The house has a small laundry room with a washer and dryer. It has new ductless heating and air units. The house is on city water, well and septic tank. The living room has a gas fireplace with propane tank outside. It has a small, detached garage for storage. Two car ports for the car and boats. We have a video of the home and area if you would like us to send it to you.
For sale by owner
Price cut: $20K (11/15)
$180,000
1542 Millstone Beach Rd, Dandridge, TN 37725
2beds
750sqft
SingleFamily
Built in 1967
4,800 Square Feet Lot
$-- Zestimate®
$240/sqft
$-- HOA
What's special
Furniture is included
What the owner loves about this home
This place has been great for our family. The neighbors are great, and Douglas Estates is a wonderful community. It has a boat launch with beach area for the community. We love the small town feel especially the 4th of July and Labor Day picnics, along with the farmer's market downtown. We will miss the Dandridge community.
- 24 days
- 883
- 46
Listed by:
Property Owner (865) 740-6950
Facts & features
Interior
Bedrooms & bathrooms
- Bedrooms: 2
- Bathrooms: 1
- Full bathrooms: 1
Heating
- Other, Electric
Cooling
- Central
Interior area
- Total interior livable area: 750 sqft
Property
Parking
- Parking features: Carport, Garage - Detached
Features
- Exterior features: Vinyl
- Has view: Yes
- View description: Water
- Has water view: Yes
- Water view: Water
Lot
- Size: 4,800 Square Feet
Details
- Parcel number: 077LA01300000
Construction
Type & style
- Home type: SingleFamily
Condition
- New construction: No
- Year built: 1967
Community & HOA
Location
- Region: Dandridge
Financial & listing details
- Price per square foot: $240/sqft
- Tax assessed value: $19,300
- Annual tax amount: $72
- Date on market: 10/23/2026
Estimated market value
Not available
Estimated sales range
Not available
$1,308/mo
Price history
| Date | Event | Price |
|---|---|---|
| 11/15/2026 | Price change | $180,000-10%$240/sqft |
Source: Owner Report a problem | ||
| 10/23/2026 | Listed for sale | $200,000$267/sqft |
Source: Owner Report a problem | ||
| 10/14/2026 | Listing removed | $200,000$267/sqft |
Source:  East Tennessee Realtors #1295174 Report a problem | ||
| 9/1/2026 | Price change | $200,000-4.8%$267/sqft |
Source: East Tennessee Realtors #1295174 Report a problem | ||
| 5/14/2026 | Listed for sale | $210,000$280/sqft |
Source: East Tennessee Realtors #1295174 Report a problem | ||
| 4/16/2026 | Pending sale | $210,000$280/sqft |
Source: East Tennessee Realtors #1295174 Report a problem | ||
| 3/19/2026 | Listed for sale | $210,000-1.9%$280/sqft |
Source: East Tennessee Realtors #1295174 Report a problem | ||
| 9/3/2025 | Price change | $214,000-4.9%$285/sqft |
Source: East Tennessee Realtors #1295174 Report a problem | ||
| 6/26/2025 | Price change | $225,000-6.2%$300/sqft |
Source: East Tennessee Realtors #1295174 Report a problem | ||
| 5/14/2025 | Price change | $239,900-4%$320/sqft |
Source: East Tennessee Realtors #1295174 Report a problem | ||
| 3/29/2025 | Listed for sale | $249,900-7.4%$333/sqft |
Source: East Tennessee Realtors #1295174 Report a problem | ||
| 3/26/2025 | Listing removed | $269,900$360/sqft |
Source:  Lakeway Area AOR #704535 Report a problem | ||
| 1/1/2025 | Listed for sale | $269,900$360/sqft |
Source: Lakeway Area AOR #704535 Report a problem | ||
| 9/30/2024 | Listing removed | $269,900-3.6%$360/sqft |
Source: Lakeway Area AOR #704535 Report a problem | ||
| 7/25/2024 | Listed for sale | $279,900+74.9%$373/sqft |
Source: Lakeway Area AOR #704535 Report a problem | ||
| 7/22/2024 | Listing removed | -- |
Source: Owner Report a problem | ||
| 7/20/2024 | Pending sale | $160,000$213/sqft |
Source: Owner Report a problem | ||
| 7/15/2024 | Listed for sale | $160,000+28%$213/sqft |
Source: Owner Report a problem | ||
| 6/17/2013 | Sold | $125,000+6150%$167/sqft |
Source: Agent Provided Report a problem | ||
| 6/11/1992 | Sold | $2,000$3/sqft |
Source: Agent Provided Report a problem | ||
Public tax history
| Year | Property taxes | Tax assessment |
|---|---|---|
| 2025 | $72 +4.2% | $4,825 |
| 2024 | $69 -28.1% | $4,825 +15.6% |
| 2023 | $96 +5% | $4,175 |
| 2022 | $91 | $4,175 |
| 2021 | $91 | $4,175 |
| 2020 | $91 | $4,175 |
| 2019 | $91 +28.6% | $4,175 +38% |
| 2018 | $71 +0.1% | $3,025 |
| 2017 | $71 | $3,025 |
| 2016 | $71 -0.1% | $3,025 |
| 2015 | $71 | $3,025 |
| 2014 | $71 | $3,025 |
| 2013 | -- | $3,025 -15.4% |
| 2012 | $77 +5.1% | $3,575 |
| 2011 | $73 | $3,575 |
| 2010 | $73 | $3,575 |
| 2009 | -- | $3,575 +66.3% |
| 2008 | $49 +10.6% | $2,150 |
| 2007 | $45 +24.7% | $2,150 +10.3% |
| 2006 | $36 | $1,950 |
| 2005 | $36 -11.2% | $1,950 |
| 2004 | $40 +5.7% | $1,950 +2.6% |
| 2003 | $38 | $1,900 -0.2% |
| 2001 | -- | $1,903 -75% |
| 2000 | -- | $7,611 |
Find assessor info on the county website
Monthly payment
Est. payment
Payment breakdown
Explore the cost of this home by adjusting the details. Changes won't be saved.Climate risks
Neighborhood: 37725
Similar homes
- $209,9002 bd2 ba924 sqft1618 Omaha Trl, Dandridge, TN 37725For Sale
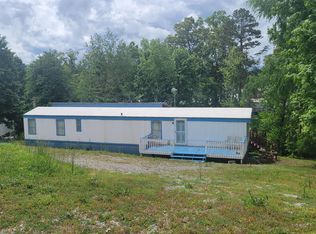
 MLS ID #710910, Marti W. Dotson, Jackson Real Estate & Auction. Lakeway Area AOR
- $180,0002 bd1 ba1k sqft532 Woodlawn Ave, Newport, TN 37821For Sale
 MLS ID #712879, Janice Jenkins, Brian Keller Realty. Lakeway Area AOR
- $195,0003 bd2 ba960 sqft935 Flat Creek Rd, Sevierville, TN 37876For Sale
 MLS ID #3628658, Karen Lay. RealTracs MLS as distributed by MLS GRID
- $179,0002 bd1 ba696 sqft1505 Old Oak Ln, Morristown, TN 37814For Sale
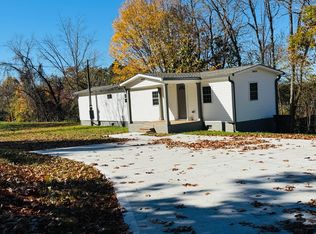 MLS ID #713529, Mitchell Elkins, Elite Realty Group. Lakeway Area AOR
- $160,0004 bd2 ba1.1k sqft508 Paintbrush Rd, Newport, TN 37821Active
 MLS ID #1360175, Abbott Mary, Capstone Realty Group. East Tennessee Realtors
- $235,0002 bd2 ba1k sqft625 English Meadows Dr, White Pine, TN 37890For SaleMLS ID #713233, Margie Wright, Wright Property Marketing Group. Lakeway Area AOR
- $196,9003 bd1 ba1k sqft322 Idlewild Dr, White Pine, TN 37890ActiveMLS ID #1343052, Missy Sanders, Stephenson Realty & Auction. East Tennessee Realtors
- $209,9002 bd1 ba1k sqft954 Highway 25/32, White Pine, TN 37890For SaleMLS ID #713433, Marty Lamb, Crye-Leike Lakeway Real Estate. Lakeway Area AOR
- $179,0003 bd1 ba1.1k sqft992 Chicken Hollow Rd, Newport, TN 37821ActiveMLS ID #1341631, Melissa Goddard, Goddard Real Estate & Auction. East Tennessee Realtors
- $189,0002 bd1 ba520 sqft1116 Guinn Dr, New Market, TN 37820For SaleMLS ID #712906, Hunter Foulks, RE/MAX Real Estate Ten Midtown. Lakeway Area AOR
- $200,0003 bd2 ba1k sqft1360 Lower English Creek Rd, Newport, TN 37821ActiveMLS ID #1357527, Wyatt Morton, Real Broker. East Tennessee Realtors
- $165,0001 bd1 ba580 sqft896 English Mountain Rd, Cosby, TN 37722For SaleMLS ID #711294, Felicia Nicole Cardwell, Southern Charm Homes. Lakeway Area AOR
- $--2 bd1 ba1k sqft1508 Willow St, Morristown, TN 37814ActiveMLS ID #1359672, Ryan George, JD's Realty & Auction, LLC. East Tennessee Realtors
- $175,0002 bd1 ba960 sqft715 Lincoln Ave, Morristown, TN 37813ActiveMLS ID #1358315, Tommy Scarlett, Realty Executives Associates. East Tennessee Realtors
- $195,0003 bd1 ba972 sqft205 English St, Newport, TN 37821For SaleMLS ID #712759, Janice Jenkins, Brian Keller Realty. Lakeway Area AOR
- $199,9002 bd1 ba864 sqft910 Lennie Ave, Morristown, TN 37813For SaleMLS ID #713155, Marty Lamb, Crye-Leike Lakeway Real Estate. Lakeway Area AOR
- $217,0003 bd2 ba1k sqft1820 Peaceful Way, Sevierville, TN 37876For SaleMLS ID #3544632, Talia Williamson. RealTracs MLS as distributed by MLS GRID
- $144,9002 bd1 ba885 sqft385 Shelton Rd, Newport, TN 37821ActiveMLS ID #1320156, Darbi Neas, Envision Realty Group. East Tennessee Realtors
- $189,9002 bd2 ba1k sqft1040 Old Solomon Ferry Rd, Newport, TN 37821ActiveMLS ID #1352757, Tara Williams, Realty Pros, LLC. East Tennessee Realtors
