Gorgeous single story home in East Lancaster with RV access and a large yard. This home features a spacious living room with a fireplace. There is a dining room connected to the kitchen and living room, perfect for entertaining. The kitchen features updated countertops, white cabinetry and stainless steel appliances. This home has 3 bedrooms and 2 bathrooms. There is a dedicated laundry room with access to the garage. The rear yard is oversized with RV access. This home is a MUST see!
For sale
Price cut: $5K (11/16)
$409,900
1544 E Norberry St, Lancaster, CA 93535
3beds
1,439sqft
Single Family Residence
Built in 1986
8,276 Square Feet Lot
$410,800 Zestimate®
$285/sqft
$-- HOA
What's special
- 37 days
- 363
- 50
Zillow last checked:
Listing updated:
Listed by:
Michael Watson DRE #01712313 661-733-2196,
Keller Williams Realty A.V.
Source: GAVAR,MLS#: 26004892
Facts & features
Interior
Bedrooms & bathrooms
- Bedrooms: 3
- Bathrooms: 2
- Full bathrooms: 1
- 3/4 bathrooms: 1
Heating
- Has Heating (Unspecified Type)
Cooling
- Has cooling: Yes
Appliances
- Included: Dishwasher, Gas Oven, Gas Range, None
- Laundry: Laundry Room
Features
- Flooring: Vinyl, Carpet
- Has fireplace: Yes
- Fireplace features: Living Room
Interior area
- Total structure area: 1,439
- Total interior livable area: 1,439 sqft
Property
Parking
- Total spaces: 2
- Parking features: Garage - Attached
- Attached garage spaces: 2
Features
- Stories: 1
- Patio & porch: Slab
- Pool features: None
- Fencing: Block,Vinyl,Wood
Lot
- Size: 8,276 Square Feet
- Features: Irregular Lot
Details
- Parcel number: 3147025012
- Zoning: LRA22
Construction
Type & style
- Home type: SingleFamily
- Architectural style: Traditional
- Property subtype: Single Family Residence
Materials
- Wood Siding
- Foundation: Slab
- Roof: Tile
Condition
- Year built: 1986
Utilities & green energy
- Water: Public
- Utilities for property: Natural Gas Available, Cable Available, Internet, Sewer Connected
Community & HOA
Location
- Region: Lancaster
Financial & listing details
- Price per square foot: $285/sqft
- Tax assessed value: $411,322
- Date on market: 10/15/2026
- Listing agreement: Exclusive Right To Sell
- Listing terms: VA Loan,Cash,Conventional,FHA
- Road surface type: Paved
Estimated market value
$410,800
$390,000 - $431,000
$2,809/mo
Price history
| Date | Event | Price |
|---|---|---|
| 11/16/2026 | Price change | $409,900-1.2%$285/sqft |
Source:  GAVAR #26004892 Report a problem | ||
| 11/2/2026 | Price change | $414,900-3.5%$288/sqft |
Source: GAVAR #26004892 Report a problem | ||
| 10/15/2026 | Listed for sale | $429,900$299/sqft |
Source: GAVAR #26004892 Report a problem | ||
| 9/12/2026 | Listing removed | $429,900$299/sqft |
Source: GAVAR #26004892 Report a problem | ||
| 9/8/2026 | Price change | $429,900-2.3%$299/sqft |
Source: GAVAR #26004892 Report a problem | ||
| 9/1/2026 | Listed for sale | $439,900$306/sqft |
Source: GAVAR #26004892 Report a problem | ||
| 8/19/2026 | Listing removed | $439,900$306/sqft |
Source:  CRMLS #SR26136009 Report a problem | ||
| 8/3/2026 | Price change | $439,900-2.2%$306/sqft |
Source: GAVAR #26004892 Report a problem | ||
| 7/9/2026 | Price change | $449,900-2.2%$313/sqft |
Source: GAVAR #26004892 Report a problem | ||
| 6/22/2026 | Listed for sale | $459,900+425.6%$320/sqft |
Source: GAVAR #26004892 Report a problem | ||
| 5/11/2012 | Sold | $87,500-3.3%$61/sqft |
Source: GAVAR #1203543 Report a problem | ||
| 9/21/2011 | Sold | $90,495-68.8%$63/sqft |
Source: Public Record Report a problem | ||
| 8/5/2005 | Sold | $290,000+128.3%$202/sqft |
Source: Public Record Report a problem | ||
| 9/4/2002 | Sold | $127,000+59.7%$88/sqft |
Source: Public Record Report a problem | ||
| 7/28/1995 | Sold | $79,500-3.2%$55/sqft |
Source: Public Record Report a problem | ||
| 11/7/1994 | Sold | $82,149$57/sqft |
Source: Public Record Report a problem | ||
Public tax history
| Year | Property taxes | Tax assessment |
|---|---|---|
| 2026 | -- | $411,322 +2% |
| 2025 | $6,366 +3.8% | $403,258 +2% |
| 2024 | $6,134 +133.6% | $395,352 +274.3% |
| 2023 | $2,626 +7.2% | $105,629 +2% |
| 2022 | $2,450 +18.1% | $103,559 -60.2% |
| 2021 | $2,074 +1% | $260,217 +159% |
| 2020 | $2,054 | $100,489 +2% |
| 2019 | $2,054 +3.2% | $98,519 +2% |
| 2018 | $1,990 | $96,588 +2% |
| 2017 | $1,990 +1% | $94,695 +2% |
| 2016 | $1,970 +4.1% | $92,839 +1.5% |
| 2015 | $1,893 +0.7% | $91,446 +2% |
| 2014 | $1,880 | $89,655 +1.9% |
| 2012 | -- | $88,000 -6.4% |
| 2011 | -- | $94,000 +18.4% |
| 2010 | -- | $79,400 -40.7% |
| 2009 | -- | $133,800 -45.3% |
| 2008 | -- | $244,600 -17.3% |
| 2007 | -- | $295,800 +2% |
| 2006 | -- | $290,000 +115.5% |
| 2005 | -- | $134,594 +4% |
| 2004 | -- | $129,370 +1.9% |
| 2003 | -- | $127,000 +42.1% |
| 2002 | -- | $89,395 +4% |
| 2000 | -- | $85,926 |
Find assessor info on the county website
Monthly payment
Est. payment
Payment breakdown
Explore the cost of this home by adjusting the details. Changes won't be saved.Climate risks
Neighborhood: Challenger
- $392,3003 bd2 ba1.2k sqft1552 E Norberry St, Lancaster, CA 93535Off Market

- $423,2003 bd2 ba1.4k sqft44611 Pinon Springs Dr, Lancaster, CA 93535Off Market

- $417,8004 bd2 ba1.7k sqft1558 E Norberry St, Lancaster, CA 93535Off Market
- $359,1003 bd2 ba1.2k sqft44617 Pinon Springs Dr, Lancaster, CA 93535Off Market
Similar homes
- $404,9003 bd2 ba1.4k sqft44446 Fenhold St, Lancaster, CA 93535For Sale
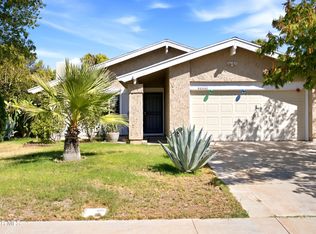 MLS ID #26007594, Juan Fernandez. GAVAR
- $419,9993 bd2 ba1.5k sqft1056 Landsford St, Lancaster, CA 93535For Sale
 MLS ID #26008490, Stephanie J Mendoza. GAVAR
- $399,0003 bd2 ba1.3k sqft44828 Fenhold St, Lancaster, CA 93535For Sale
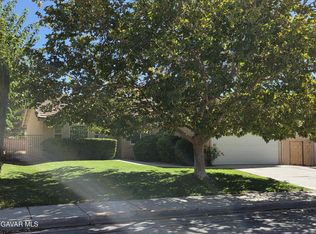 MLS ID #26008367, Patrick J Hunt. GAVAR
- $429,9993 bd3 ba1.7k sqft1768 Sierra View Ave, Lancaster, CA 93535For Sale
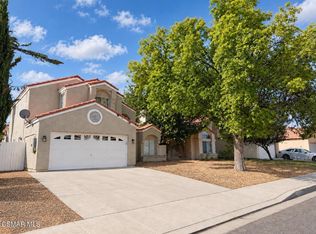 MLS ID #226004467, Dianna Y Martinez, eXp Realty of Greater Los Angeles Inc.. CSMAOR
