155 Clifton Street includes five (5) full size studios and a twelve (12) room lodging house. This property was fully renovated in 2019 with new windows, hardwood floors as well as fire safety and sprinkler systems. This commuter location provides easy access to Downtown Boston Financial District, Assembly Row, Encore Casino and Revere Beach. The 99 & 132 Bus Line stop is conveniently located in front of the building.
For sale
Price cut: $100K (11/2)
$2,195,000
155 Clifton St, Malden, MA 02148
13beds
9,167sqft
5+ Family - Rooming House
Built in 2019
-- sqft lot
$-- Zestimate®
$239/sqft
$-- HOA
What's special
New windowsHardwood floors
- 38 days
- 329
- 14
Zillow last checked:
Listing updated:
Listed by:
Evan Griffith 617-501-8895,
Marcus & Millichap Real Estate Investment Services 617-896-7200,
Evan Griffith 617-501-8895
Source: MLS PIN,MLS#: 73585784
Facts & features
Interior
Bedrooms & bathrooms
- Bedrooms: 13
- Bathrooms: 9
- Full bathrooms: 9
Features
- Has basement: Yes
- Has fireplace: No
Interior area
- Total structure area: 9,167
- Total interior livable area: 9,167 sqft
- Finished area above ground: 9,167
Property
Parking
- Total spaces: 11
- Parking features: Garage
- Garage spaces: 1
- Uncovered spaces: 10
Lot
- Size: 8,233 Square Feet
- Features: Other
Details
- Parcel number: 591471
- Zoning: 0
Construction
Type & style
- Home type: MultiFamily
- Property subtype: 5+ Family - Rooming House
Materials
- Foundation: Other
Condition
- Year built: 2019
Utilities & green energy
- Sewer: Public Sewer
- Water: Public
Community & HOA
Location
- Region: Malden
Financial & listing details
- Price per square foot: $239/sqft
- Tax assessed value: $2,655,400
- Annual tax amount: $30,272
- Date on market: 10/1/2026
- Total actual rent: 20829
Estimated market value
Not available
Estimated sales range
Not available
$2,000/mo
Price history
| Date | Event | Price |
|---|---|---|
| 11/2/2026 | Price change | $2,195,000-4.4%$239/sqft |
Source: MLS PIN #73585784 Report a problem | ||
| 10/2/2026 | Listed for sale | $2,295,000-10%$250/sqft |
Source: MLS PIN #73585784 Report a problem | ||
| 10/1/2024 | Listed for rent | $1,200-21.3% |
Source: Zillow Rentals Report a problem | ||
| 1/3/2024 | Listing removed | $2,550,000$278/sqft |
Source: MLS PIN #73177651 Report a problem | ||
| 11/6/2023 | Listed for sale | $2,550,000+8.5%$278/sqft |
Source: MLS PIN #73177651 Report a problem | ||
| 3/28/2021 | Listing removed | -- |
Source: Zillow Rental Network Premium Report a problem | ||
| 3/18/2021 | Listed for rent | $1,525+17.3% |
Source: Zillow Rental Network Premium Report a problem | ||
| 2/6/2021 | Listing removed | -- |
Source: Zillow Rental Network Premium Report a problem | ||
| 11/6/2020 | Price change | $1,300-13.3% |
Source: Thatch Report a problem | ||
| 10/15/2020 | Listed for rent | $1,500-3.2% |
Source: Thatch Report a problem | ||
| 7/4/2020 | Listing removed | $1,550 |
Source: Thatch Report a problem | ||
| 5/27/2020 | Listed for rent | $1,550 |
Source: Thatch Report a problem | ||
| 6/14/2019 | Listing removed | $2,350,000$256/sqft |
Source: RCG Properties #72504343 Report a problem | ||
| 5/31/2019 | Pending sale | $2,350,000$256/sqft |
Source: RCG Properties #72504343 Report a problem | ||
| 5/21/2019 | Listed for sale | $2,350,000+1324.2%$256/sqft |
Source: RCG Properties #72504343 Report a problem | ||
| 1/27/1993 | Sold | $165,000$18/sqft |
Source: Public Record Report a problem | ||
Public tax history
| Year | Property taxes | Tax assessment |
|---|---|---|
| 2025 | $28,911 +3.6% | $2,554,000 +7% |
| 2024 | $27,897 +3% | $2,386,400 +7.5% |
| 2023 | $27,072 +6.6% | $2,220,800 +8% |
| 2022 | $25,388 +4.1% | $2,055,700 +3.5% |
| 2021 | $24,399 -17.9% | $1,985,300 -15.5% |
| 2020 | $29,710 +252.9% | $2,348,600 +270.1% |
| 2019 | $8,420 -30.4% | $634,500 -26.1% |
| 2018 | $12,096 +10% | $858,500 +10.6% |
| 2017 | $11,000 +2.9% | $776,300 +10.1% |
| 2016 | $10,692 +5.9% | $705,300 +9.9% |
| 2015 | $10,092 +10.3% | $641,600 +12.9% |
| 2014 | $9,151 +32.4% | $568,400 +30.6% |
| 2013 | $6,911 +16.1% | $435,200 +4.7% |
| 2012 | $5,954 +0.1% | $415,500 -5.1% |
| 2011 | $5,948 +2.6% | $438,000 -6.4% |
| 2010 | $5,797 -13.5% | $467,900 -30.8% |
| 2009 | $6,702 +4.9% | $676,300 -4.3% |
| 2008 | $6,389 +5.5% | $706,800 -3.7% |
| 2007 | $6,054 +4.9% | $733,800 +4.4% |
| 2006 | $5,771 -0.6% | $702,900 +5.2% |
| 2005 | $5,807 +40.2% | $668,200 +43.8% |
| 2004 | $4,141 +19.7% | $464,800 +88.9% |
| 2003 | $3,459 +3.8% | $246,000 |
| 2002 | $3,331 +5.4% | $246,000 +35.7% |
| 2000 | $3,160 +3.4% | $181,300 |
| 1999 | $3,055 | $181,300 |
Find assessor info on the county website
Monthly payment
Est. payment
Payment breakdown
Explore the cost of this home by adjusting the details. Changes won't be saved.Climate risks
Neighborhood: West End


Similar homes
- $2,249,00010 bd6 ba4.5k sqft59 Lubec St, Boston, MA 02128For Sale
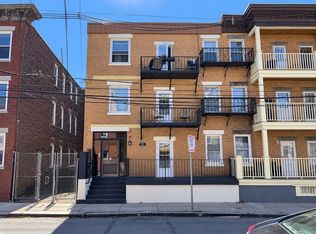 MLS ID #73597137, Evan Griffith, Marcus & Millichap Real Estate Investment Services. MLS PIN
- $2,000,00011 bd13 ba5k sqft43 Wright Ave, Medford, MA 02155For Sale
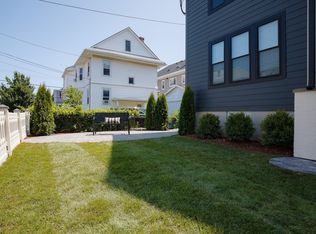 MLS ID #73585752, Currier, Lane & Young, Compass. MLS PIN
- $1,869,00015 bd7 ba7.5k sqft159 Pearl St, Somerville, MA 02145For Sale
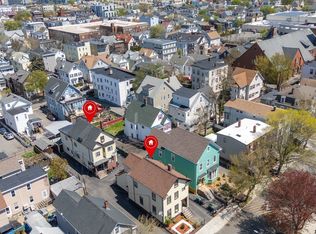 MLS ID #73515418, Kevin Fernandes, Century 21 Realty Network. MLS PIN
- $2,195,00016 bd8 ba4.7k sqft31-33 Lothrop St, Brighton, MA 02135For Sale
 MLS ID #73549910, Chris Kostopoulos Group, Keller Williams Realty. MLS PIN
