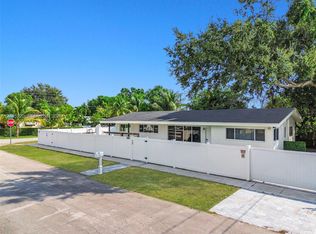
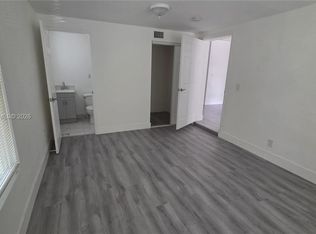
3 Bedroom and 2 baths house for rent in North Miami Beach, washer & Dryer inside the house, wood flooring, few minutes to I-95. mango & avocado trees.
For sale
$550,000
161 NE 171st Ter, Miami, FL 33162
3beds
1,505sqft
Single Family Residence
Built in 1953
8,100 Square Feet Lot
$530,200 Zestimate®
$365/sqft
$-- HOA
What's special
Mango and avocado treesWood flooring
- 5 days
- 77
- 2
Likely to sell faster than
Zillow last checked:
Listing updated:
Listed by:
Zhi Wei Wu 786-252-1333,
Atlantic Realty & Inv. Corp.
Source: MIAMI,MLS#: A12122445 Originating MLS: A-Miami Association of REALTORS
Facts & features
Interior
Bedrooms & bathrooms
- Bedrooms: 3
- Bathrooms: 2
- Full bathrooms: 2
Rooms
- Room types: Family Room
Heating
- Central, Electric
Cooling
- Central Air, Electric
Appliances
- Included: Dryer, Electric Range, Microwave, Refrigerator, Washer
Features
- Other
- Flooring: Ceramic Tile, Wood
- Windows: Blinds
Interior area
- Total interior livable area: 1,505 sqft
Video & virtual tour
Property
Parking
- Total spaces: 3
- Parking features: Driveway
- Carport spaces: 3
- Has uncovered spaces: Yes
Features
- Stories: 1
- Patio & porch: Patio
- Pool features: R30-No Pool/No Water
- Fencing: Fenced
- Has view: Yes
- View description: Garden
Lot
- Size: 8,100 Square Feet
- Features: 1/4 To Less Than 1/2 Acre Lot
- Residential vegetation: Fruit Trees
Details
- Parcel number: 3021120060230
- Zoning: 0100
Construction
Type & style
- Home type: SingleFamily
- Property subtype: Single Family Residence
Materials
- CBS Construction
- Roof: Shingle
Condition
- Year built: 1953
Utilities & green energy
- Sewer: Septic Tank
- Water: Municipal Water
Community & HOA
Community
- Features: None, No Subdiv/Park Info
- Subdivision: No Miami Beach Manor
HOA
- Has HOA: No
Location
- Region: Miami
Financial & listing details
- Price per square foot: $365/sqft
- Tax assessed value: $461,958
- Annual tax amount: $1,982
- Date on market: 11/12/2026
- Listing terms: All Cash,Conventional,FHA
Estimated market value
$530,200
$504,000 - $557,000
$2,517/mo
Price history
| Date | Event | Price |
|---|---|---|
| 11/12/2026 | Listed for sale | $550,000+633.3%$365/sqft |
Source:  MIAMI #A12122445 Report a problem | ||
| 10/21/2011 | Sold | $75,000-6.1%$50/sqft |
Source: Agent Provided Report a problem | ||
| 7/20/2011 | Listing removed | $79,900$53/sqft |
Source: Keller Williams Elite Prop. #A1525772 Report a problem | ||
| 7/14/2011 | Listed for sale | $79,900-20%$53/sqft |
Source: Keller Williams Elite Prop. #A1525772 Report a problem | ||
| 6/2/2011 | Listing removed | $99,900$66/sqft |
Source: Keller Williams Elite Prop. #M1363231 Report a problem | ||
| 10/31/2010 | Listed for sale | $99,900-9.1%$66/sqft |
Source: F & D Holdings LLC dba Keller Williams Elite Properties #M1363231 Report a problem | ||
| 4/8/2010 | Listed for sale | $109,900+14.5%$73/sqft |
Source: Dominion Enterprises #M1363231 Report a problem | ||
| 11/14/2000 | Sold | $96,000$64/sqft |
Source: Public Record Report a problem | ||
Public tax history
| Year | Property taxes | Tax assessment |
|---|---|---|
| 2025 | $2,020 +2.7% | $118,482 +2.9% |
| 2024 | $1,966 +11.2% | $115,143 +3% |
| 2023 | $1,768 +5.8% | $111,790 +3% |
| 2022 | $1,671 +2.3% | $108,534 +3% |
| 2021 | $1,634 +1.2% | $105,373 +1.4% |
| 2020 | $1,614 +2.4% | $103,919 +2.3% |
| 2019 | $1,576 +5.8% | $101,583 +1.9% |
| 2018 | $1,490 | $99,689 +2% |
| 2017 | $1,490 +1% | $97,762 +2.1% |
| 2016 | $1,475 +1.6% | $95,752 +0.7% |
| 2015 | $1,452 -0.9% | $95,087 +0.8% |
| 2014 | $1,465 +3.7% | $94,333 +1.5% |
| 2013 | $1,413 | $92,939 +1.2% |
| 2012 | $1,413 -21% | $91,815 -17.6% |
| 2011 | $1,788 -4.2% | $111,386 +1.5% |
| 2010 | $1,867 +9% | $109,740 +2.7% |
| 2009 | $1,713 -61.5% | $106,855 -55.6% |
| 2007 | $4,448 +168.7% | $240,907 |
| 2006 | $1,655 | -- |
| 2005 | $1,655 +2.4% | -- |
| 2004 | $1,617 +8.4% | -- |
| 2003 | $1,491 +10.6% | -- |
| 2002 | $1,349 | -- |
| 2001 | $1,349 | -- |
Find assessor info on the county website
Monthly payment
Est. payment
Payment breakdown
Explore the cost of this home by adjusting the details. Changes won't be saved.Climate risks
Neighborhood: Uleta

Similar homes
- $548,5003 bd2 ba1.2k sqftSeaboard Park, North Miami Beach, FL 33162For Sale
 MLS ID #A12105220, John Salt, EXP Realty LLC. MIAMI
- $580,0003 bd2 ba1.7k sqftCon-Gia Mnr, Miami, FL 33162For Sale
 MLS ID #A12092353, Serge Clerisier, S & N First Choice Realty, Inc.. MIAMI
- $524,8003 bd2 ba1.6k sqftHighland Manor Sec 5, North Miami Beach, FL 33162For Sale
 MLS ID #A12085839, Ronald Henry, Premier Realty & Invest. Group. MIAMI
- $573,0004 bd2 ba1.1k sqftFulford Highlands 1st Add, Miami, FL 33162For Sale
 MLS ID #A12120941, Fabio Hoyos, Paramount International Real Estate LLC. MIAMI
- $559,0003 bd2 ba1.3k sqftOleta Terr N Miami Beach, North Miami Beach, FL 33162For SaleMLS ID #A12101141, Maria Magarino, Paradise Florida Realty Inc. MIAMI
- $529,2003 bd2 ba1.2k sqftNorth Beach Park, North Miami Beach, FL 33162For SaleMLS ID #A12054030, William Tordjman, Flat Fee Florida Realty LLC. MIAMI
- $495,0003 bd2 ba1.1k sqftJudy Manors, North Miami Beach, FL 33162For SaleMLS ID #A12102804, Julia Poliadis, One Sotheby's International Realty. MIAMI
- $450,0003 bd2 ba1.4k sqftCon-Gia Mnr, Miami, FL 33162For SaleMLS ID #A12112782, Roland Cherasard, EXP Realty LLC. MIAMI
- $590,0003 bd2 ba1.2k sqft1st Addn To Panuleta Gard, North Miami Beach, FL 33162For SaleMLS ID #A12101151, Michael Biberman, Majestic Prime Realty, Inc. MIAMI
- $500,0004 bd2 ba942 sqftFulford Highlands 3 Addn, Miami, FL 33162For SaleMLS ID #A12122709, Gary Francois, Comlux Properties. MIAMI
- $479,0003 bd2 ba1.2k sqftJunior Heights, North Miami Beach, FL 33162For SaleMLS ID #A12054383, Lisa Thomson, Coldwell Banker Realty. MIAMI
- $510,0003 bd2 ba1.3k sqft710 NE 161ST Street, Miami, FL 33162For Sale
 MLS ID #B26095790, Jeffrey Nicolas, The Nice Agent Co. BeachesMLS
- $549,9992 bd1 ba880 sqftFulford By Sea Sec N, North Miami Beach, FL 33162For SaleMLS ID #A12119229, Yaakov Rosenberg, EXP Realty LLC. MIAMI
- $580,0003 bd3 ba1.4k sqftPleasant Village, Miami, FL 33162For SaleMLS ID #A12071404, Jose Gonzalez, Miami New Realty. MIAMI
- $650,0004 bd2 ba1.5k sqftSeaboard Park, North Miami Beach, FL 33162For SaleMLS ID #A12123795, Veronika Bloemhof, The Bloemhof Group LLC. MIAMI
- $550,0004 bd2 ba1.3k sqftFulford By Sea Sec N, North Miami Beach, FL 33162For SaleMLS ID #A12014352, Denise Renslow, Coldwell Banker Realty. MIAMI
- $560,0003 bd2 ba1.1k sqftFulford By The Sea Rev Pl, North Miami Beach, FL 33162For SaleMLS ID #A12068232, Celeste Silva, NP Services 75. MIAMI
- $669,9004 bd2 ba1.6k sqftSeaboard Park, North Miami Beach, FL 33162For SaleMLS ID #A12107536, Mona Heisler, Beachfront Realty Inc. MIAMI
- $525,0003 bd2 ba1.2k sqftFleeman Heights, North Miami Beach, FL 33162For SaleMLS ID #A12057257, Steven Koleno, Beycome of Florida LLC. MIAMI
- $650,0004 bd2 ba1.8k sqftHighland Manor Sec 5, North Miami Beach, FL 33162For SaleMLS ID #A12048324, Glenis Jimenez, Beachfront Realty Inc. MIAMI
