Lovely mountain cabin in the gated community of Black Gum Ridge. Less than 3 miles to the town of Blue Ridge with privacy within a wooded setting. House has 3 levels with a bedroom and bath and spacious closets and walk outs to deck. Cabin has wood floors, high ceilings, and a stacked stone fireplace. The downstairs game room includes a pool table and a walk out to hot tub.
For sale by owner
$659,000
166 Dallas Ln, Blue Ridge, GA 30513
4beds
2,520sqft
SingleFamily
Built in 2007
1 Acres Lot
$645,800 Zestimate®
$262/sqft
$25/mo HOA
What's special
Stacked stone fireplaceHigh ceilingsWood floorsWalk outs to deckDownstairs game roomSpacious closetsPool table
What the owner loves about this home
Privacy yet convient to town. Spacious yard and walking trails.
- 2 days
- 864
- 34
Listed by:
Property Owner (770) 365-0350
Facts & features
Interior
Bedrooms & bathrooms
- Bedrooms: 4
- Bathrooms: 3
- Full bathrooms: 3
Heating
- Forced air, Electric, Gas
Cooling
- Central
Appliances
- Included: Dishwasher, Dryer, Microwave, Range / Oven, Refrigerator, Washer
- Laundry: In Unit
Features
- Flooring: Hardwood, Laminate
- Basement: Finished
- Has fireplace: Yes
- Furnished: Yes
Interior area
- Total interior livable area: 2,520 sqft
Property
Parking
- Total spaces: 10
- Parking features: Off-street
Features
- Exterior features: Stone, Wood
- Has spa: Yes
- Has view: Yes
- View description: Park
Lot
- Size: 1 Acres
Details
- Parcel number: 004500726A01
Construction
Type & style
- Home type: SingleFamily
Materials
- log
- Foundation: Masonry
- Roof: Asphalt
Condition
- New construction: No
- Year built: 2007
Community & HOA
HOA
- Has HOA: Yes
- HOA fee: $25 monthly
Location
- Region: Blue Ridge
Financial & listing details
- Price per square foot: $262/sqft
- Tax assessed value: $483,968
- Annual tax amount: $1,756
- Date on market: 10/26/2026
Estimated market value
$645,800
$614,000 - $678,000
$2,815/mo
Price history
| Date | Event | Price |
|---|---|---|
| 10/27/2026 | Listed for sale | $659,000-2.9%$262/sqft |
Source: Owner Report a problem | ||
| 10/25/2026 | Listing removed | $7,200$3/sqft |
Source: Zillow Rentals Report a problem | ||
| 10/23/2026 | Listed for rent | $7,200+105.7%$3/sqft |
Source: Zillow Rentals Report a problem | ||
| 10/20/2026 | Listing removed | $679,000$269/sqft |
Source:  FMLS GA #7733341 Report a problem | ||
| 9/4/2026 | Listed for sale | $679,000$269/sqft |
Source: NGBOR #428529 Report a problem | ||
| 8/26/2026 | Pending sale | $679,000$269/sqft |
Source:  GAMLS #10708103 Report a problem | ||
| 7/13/2026 | Price change | $679,000-3%$269/sqft |
Source: GAMLS #10708103 Report a problem | ||
| 3/11/2026 | Listed for sale | $699,900$278/sqft |
Source: NGBOR #428529 Report a problem | ||
| 10/26/2025 | Listing removed | $699,900$278/sqft |
Source: NGBOR #415320 Report a problem | ||
| 5/2/2025 | Listed for sale | $699,900-4.7%$278/sqft |
Source: NGBOR #415320 Report a problem | ||
| 4/14/2025 | Listing removed | $734,777$292/sqft |
Source: NGBOR #407742 Report a problem | ||
| 8/30/2024 | Listed for sale | $734,777-1.4%$292/sqft |
Source: NGBOR #407742 Report a problem | ||
| 8/5/2024 | Listing removed | -- |
Source: GAMLS #20170299 Report a problem | ||
| 6/6/2024 | Price change | $745,000-1.3%$296/sqft |
Source: NGBOR #401264 Report a problem | ||
| 5/14/2024 | Price change | $755,000-1.3%$300/sqft |
Source: NGBOR #401264 Report a problem | ||
| 4/5/2024 | Listed for sale | $765,000$304/sqft |
Source: NGBOR #401264 Report a problem | ||
| 3/22/2024 | Pending sale | $765,000$304/sqft |
Source:  Mountain Lakes BOR #147525 Report a problem | ||
| 2/6/2024 | Listed for sale | $765,000+178.2%$304/sqft |
Source: NGBOR #401264 Report a problem | ||
| 7/16/2023 | Listing removed | -- |
Source: Zillow Rentals Report a problem | ||
| 6/25/2023 | Listed for rent | $3,500$1/sqft |
Source: Zillow Rentals Report a problem | ||
| 2/24/2009 | Sold | $275,000+3.1%$109/sqft |
Source: Public Record Report a problem | ||
| 6/8/2007 | Sold | $266,644$106/sqft |
Source: Public Record Report a problem | ||
Public tax history
| Year | Property taxes | Tax assessment |
|---|---|---|
| 2025 | $1,756 -1% | $193,587 |
| 2024 | $1,774 +199.2% | $193,587 +9.7% |
| 2023 | $593 +0% | $176,414 -0.9% |
| 2022 | $593 -27.5% | $178,090 +73.4% |
| 2021 | $817 -28.2% | $102,700 +25.1% |
| 2020 | $1,138 -3.5% | $82,124 +1.2% |
| 2019 | $1,179 -4% | $81,124 +1.8% |
| 2018 | $1,228 +6.5% | $79,724 +17.5% |
| 2016 | $1,153 | $67,878 +8.5% |
| 2015 | $1,153 +3.9% | $62,557 -21.7% |
| 2014 | $1,110 -9.8% | $79,846 -3.7% |
| 2013 | $1,231 | $82,951 |
Find assessor info on the county website
Monthly payment
Est. payment
Payment breakdown
Explore the cost of this home by adjusting the details. Changes won't be saved.Climate risks
Neighborhood: 30513
Similar homes
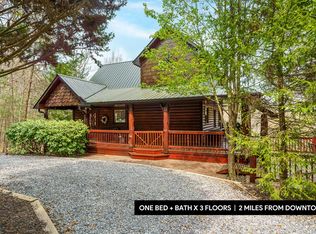
- $775,0003 bd3 ba2k sqft113 Dallas Ln, Blue Ridge, GA 30513For Sale
 MLS ID #435190, Wesley Smith, REMAX Town & Country - BR Downtown. NGBOR
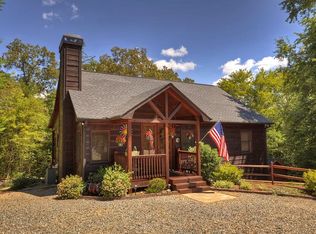
- $654,9003 bd3 ba2.2k sqft398 Mountain Tops Cir, Blue Ridge, GA 30513For Sale
 MLS ID #434114, Jason Marsh, Coldwell Banker High Country Realty - Blue Ridge. NGBOR
- $678,5003 bd3 ba2.3k sqft115 Lakota Trl, Blue Ridge, GA 30513For Sale
 MLS ID #432725, Michael Miller, Coldwell Banker High Country Realty - Blue Ridge. NGBOR
- $639,4504 bd3 ba1.8k sqft115 Fox Run Dr, Blue Ridge, GA 30513For Sale
 MLS ID #434826, Julie Fitts Queen, REMAX Town & Country - Blue Ridge. NGBOR
- $829,0003 bd3 ba2.8k sqft24 Twin Lakes Rd, Blue Ridge, GA 30513Active
 MLS ID #10871890, Susie Stanley, Mountain Sotheby's International. GAMLS
- $720,0003 bd4 ba2.2k sqft161 Huntington Way #8, Blue Ridge, GA 30513ActiveMLS ID #10804126, Kellie Nuckolls, ReMax Town & Ctry-Downtown. GAMLS
- $665,0003 bd2 ba1.5k sqft73 Rosiey Ln, Blue Ridge, GA 30513ActiveMLS ID #10832065, Andrea Schoenthal, Living Down South Realty. GAMLS
- $720,0003 bd3 ba1.9k sqft40 Foxfire Ln #6, Blue Ridge, GA 30513ActiveMLS ID #10780191, Teesha Morgan, RE/MAX Town & Country. GAMLS
