Opportunity awaits! This 3-bedroom, 2-bath home is ready for a little TLC and a fresh vision. Conveniently located near downtown Lubbock and Texas Tech, this property offers plenty of potential for those ready to make it their own. Priced to sell and ready for its next chapter!
Pending
$75,000
1703 43rd St, Lubbock, TX 79412
3beds
1,580sqft
Single Family Residence, Residential
Built in 1945
6,969 Square Feet Lot
$86,300 Zestimate®
$47/sqft
$-- HOA
What's special
- 3 days
- 243
- 18
Likely to sell faster than
Zillow last checked:
Listing updated:
Listed by:
Sasha Austin TREC #0677364 806-787-3935,
Western Heritage Realty/Invest
Source: LBMLS,MLS#: 202615140
Facts & features
Interior
Bedrooms & bathrooms
- Bedrooms: 3
- Bathrooms: 2
- Full bathrooms: 2
Heating
- Natural Gas
Cooling
- Electric
Appliances
- Included: Oven
- Laundry: None
Features
- Other
- Flooring: Hardwood
- Has fireplace: No
Interior area
- Total structure area: 1,580
- Total interior livable area: 1,580 sqft
- Finished area above ground: 1,580
Property
Parking
- Total spaces: 1
- Parking features: Attached, Garage
- Attached garage spaces: 1
Features
- Patio & porch: Front Porch
- Exterior features: None
- Fencing: Wood
Lot
- Size: 6,969 Square Feet
Details
- Parcel number: R49521
Construction
Type & style
- Home type: SingleFamily
- Architectural style: Traditional
- Property subtype: Single Family Residence, Residential
Materials
- Brick
- Foundation: Slab
- Roof: Composition
Condition
- Fixer
- New construction: No
- Year built: 1945
Utilities & green energy
- Sewer: Public Sewer
- Water: Public
Community & HOA
Community
- Security: None
Location
- Region: Lubbock
Financial & listing details
- Price per square foot: $47/sqft
- Tax assessed value: $113,881
- Annual tax amount: $1,997
- Date on market: 11/10/2026
- Cumulative days on market: 3 days
- Listing terms: Cash,Conventional
- Road surface type: All Weather
Estimated market value
$86,300
$63,000 - $111,000
$1,289/mo
Price history
| Date | Event | Price |
|---|---|---|
| 11/12/2026 | Pending sale | $75,000$47/sqft |
Source:  LBMLS #202615140 Report a problem | ||
| 11/10/2026 | Listed for sale | $75,000$47/sqft |
Source: LBMLS #202615140 Report a problem | ||
Public tax history
| Year | Property taxes | Tax assessment |
|---|---|---|
| 2026 | -- | $113,881 +0.9% |
| 2025 | $1,997 +16.3% | $112,881 +19.4% |
| 2024 | $1,717 -6.6% | $94,559 -4.3% |
| 2023 | $1,837 -8.2% | $98,850 |
| 2022 | $2,001 +48.1% | $98,850 +36.1% |
| 2021 | $1,351 +7.5% | $72,639 +23.8% |
| 2020 | $1,257 -1.5% | $58,688 |
| 2019 | $1,276 -13.7% | $58,688 +21.7% |
| 2018 | $1,478 | $48,238 -26.6% |
| 2017 | $1,478 +1.6% | $65,761 |
| 2016 | $1,456 | $65,761 +5.8% |
| 2015 | $1,456 | $62,131 -5.1% |
| 2014 | $1,456 | $65,463 |
| 2013 | -- | $65,463 |
| 2012 | -- | $65,463 |
| 2011 | -- | $65,463 |
| 2010 | -- | $65,463 +5.4% |
| 2009 | -- | $62,131 +1.7% |
| 2008 | -- | $61,105 -13.4% |
| 2007 | -- | $70,552 +6.6% |
| 2006 | -- | $66,166 |
| 2005 | -- | $66,166 +119.4% |
| 2004 | -- | $30,151 -5.8% |
| 2003 | -- | $32,000 +7.8% |
| 2002 | $736 -6.8% | $29,684 -7% |
| 2001 | $790 +0.7% | $31,903 |
| 2000 | $784 | $31,903 |
Find assessor info on the county website
Monthly payment
Est. payment
Payment breakdown
Explore the cost of this home by adjusting the details. Changes won't be saved.Climate risks
Neighborhood: Clapp Park

Similar homes
- $75,0002 bd1 ba1.6k sqft2605 Avenue L, Lubbock, TX 79411For Sale
 MLS ID #202615155, Erica Meseke, Reside Real Estate Co.. LBMLS
- $70,0003 bd1 ba1.4k sqft2012 39th St, Lubbock, TX 79412For Sale
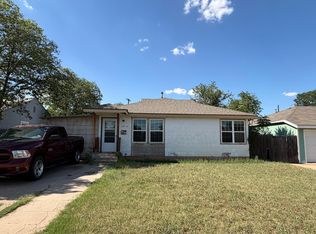 MLS ID #202613363, Venancia Flores, Michelle Kauffman Real Estate. LBMLS
- $69,0003 bd1 ba912 sqft3106 2nd Pl, Lubbock, TX 79415For Sale
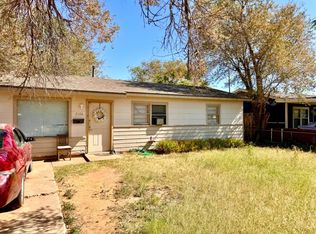 MLS ID #202615284, Ragan Watson, Brick & Loft Realty. LBMLS
- $69,0003 bd1 ba984 sqft3014 Duke St, Lubbock, TX 79415For Sale
 MLS ID #202615253, Collen Melton, Brick & Loft Realty. LBMLS
