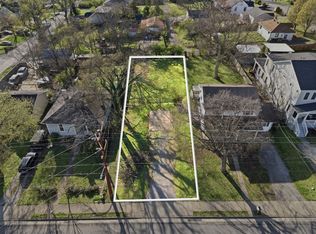
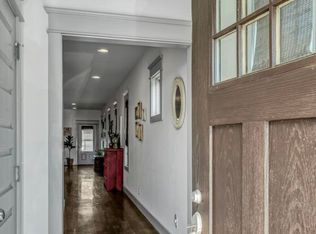
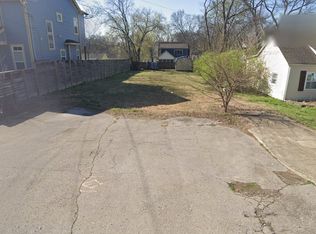
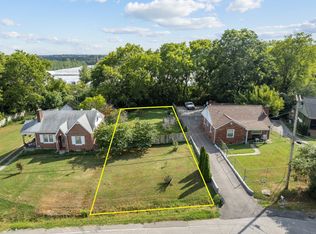
Minutes to Downtown - buildable East Nashville lot in Dadu Overlay. Sold with current duplex that will need work. As-is where-is. Sold together as package deal ONLY with 1704 Lischey (mls# 3154813 ). Has 2x water 2xelectric and 2x gas service, one sewer line in place . New builds with DADU selling between 1.2-1.475M comps attached (cross listed as duplex MLS # 3154840 )
Active
Price increase: $25K (6/7)
$425,000
1706 Lischey Ave, Nashville, TN 37207
--beds
--baths
8,276Square Feet
Unimproved Land
Built in ----
8,276 Square Feet Lot
$-- Zestimate®
$--/sqft
$-- HOA
What's special
- 105 days |
- 44 |
- 1 |
Zillow last checked:
Listing updated:
Listed by:
Samantha Stephens 815-509-9509,
Real Broker 844-591-7325
Source: RealTracs MLS as distributed by MLS GRID,MLS#: 3154823
Facts & features
Interior
Interior area
- Total structure area: 0
Property
Lot
- Size: 8,276 Square Feet
- Dimensions: 50 x 164
- Features: Level
- Topography: Level
Details
- Parcel number: 07112000500
- Zoning: Rs5ov
- Special conditions: Standard
Utilities & green energy
- Sewer: Public Sewer
- Water: Public
- Utilities for property: Water Available
Community & HOA
Community
- Subdivision: Trinity Heights
HOA
- Has HOA: No
Location
- Region: Nashville
Financial & listing details
- Tax assessed value: $488,700
- Annual tax amount: $6,064
- Date on market: 3/19/2026
- Inclusions: Land And Buildings
- Road surface type: Concrete
Estimated market value
Not available
Estimated sales range
Not available
Not available
Price history
| Date | Event | Price |
|---|---|---|
| 6/7/2026 | Price change | $425,000+6.3% |
Source: | ||
| 5/20/2026 | Price change | $400,000-5.9% |
Source: | ||
| 4/3/2026 | Price change | $425,000-5.6% |
Source: | ||
| 3/20/2026 | Listed for sale | $450,000+650% |
Source: | ||
| 11/6/2023 | Listing removed | -- |
Source: Zillow Rentals Report a problem | ||
| 10/23/2023 | Listed for rent | $1,685-2.9% |
Source: Zillow Rentals Report a problem | ||
| 6/20/2023 | Listing removed | -- |
Source: Zillow Rentals Report a problem | ||
| 6/17/2023 | Price change | $1,735-2.8% |
Source: Zillow Rentals Report a problem | ||
| 6/16/2023 | Listed for rent | $1,785 |
Source: Zillow Rentals Report a problem | ||
| 1/31/2013 | Sold | $60,000-14.2% |
Source: | ||
| 12/2/2012 | Price change | $69,900-12.5% |
Source: Coldwell Banker Lakeside Realtors #1379349 Report a problem | ||
| 9/19/2012 | Price change | $79,900-25.9% |
Source: Coldwell Banker Lakeside, Realtors #1379349 Report a problem | ||
| 7/17/2012 | Listed for sale | $107,900-1.8% |
Source: foreclosure.com Report a problem | ||
| 6/13/2012 | Listing removed | $109,900 |
Source: Revolution Real Estate #1310558 Report a problem | ||
| 12/30/2011 | Price change | $109,900-4.4% |
Source: Revolution Real Estate #1300215 Report a problem | ||
| 12/10/2011 | Price change | $114,900-3.4% |
Source: Revolution Real Estate #1300215 Report a problem | ||
| 11/9/2011 | Price change | $118,900-4.9% |
Source: Revolution Real Estate #1300215 Report a problem | ||
| 8/21/2011 | Listed for sale | $125,000 |
Source: Revolution Real Estate #1300215 Report a problem | ||
Public tax history
| Year | Property taxes | Tax assessment |
|---|---|---|
| 2025 | $5,501 +56.6% | $195,480 +81.1% |
| 2024 | $3,512 | $107,920 |
| 2023 | $3,512 | $107,920 |
| 2022 | $3,512 -1% | $107,920 |
| 2021 | $3,548 +5.5% | $107,920 +35.4% |
| 2020 | $3,365 +33.8% | $79,720 |
| 2019 | $2,515 | $79,720 |
| 2018 | $2,515 | $79,720 |
| 2017 | $2,515 | $79,720 +126.2% |
| 2016 | $2,515 +58% | $35,240 |
| 2015 | $1,591 | $35,240 |
| 2014 | $1,591 | $35,240 |
| 2013 | -- | $35,240 -1.9% |
| 2012 | -- | $35,920 |
| 2011 | -- | $35,920 |
| 2010 | -- | $35,920 -5.2% |
| 2009 | -- | $37,880 +33.8% |
| 2008 | -- | $28,320 |
| 2007 | -- | $28,320 |
| 2006 | -- | -- |
| 2005 | -- | -- |
| 2004 | -- | -- |
| 2003 | -- | -- |
| 2002 | -- | -- |
| 2001 | -- | -- |
| 2000 | -- | -- |
Find assessor info on the county website
Monthly payment
Estimated monthly payment$1,822
All calculations are estimates and provided by Zillow, Inc. for informational purposes only. Actual amounts may vary.
HOA fees may include property taxes on listings classified as Co-Ops. Contact the listing agent and/or owner for fee details.
Mortgage interest rates are dependent on a number of factors, including credit score, down payment, and repayment length. Interest rate data provided by Zillow Group Marketplace, Inc. as of 1/1/1970 from various mortgage lenders with which we have lead or other similar arrangements; the Estimated Payment is an average of those rates.
See how much you could borrow to make a competitive offer.
Climate risks
Neighborhood: Highland Heights
Nearby schools
GreatSchools rating
- 4/10Tom Joy Elementary SchoolGrades: PK-5Distance: 0.6 mi
- 4/10Jere Baxter Middle SchoolGrades: 6-8Distance: 1.3 mi
- 3/10Maplewood Comp High SchoolGrades: 9-12Distance: 2.2 mi
Schools provided by the listing agent
- Elementary: Tom Joy Elementary
- Middle: Jere Baxter Middle
- High: Maplewood Comp High School
Source: RealTracs MLS as distributed by MLS GRID. This data may not be complete. We recommend contacting the local school district to confirm school assignments for this home.

A local agent can set up tours, give advice and negotiate with sellers.


- Tennessee
- Davidson County
- Nashville
- 37207
- Highland Heights
- 1706 Lischey Ave
Nearby cities
Nearby neighborhoods
Nearby zip codes
Other Nashville Topics
