Great opportunity to own a Quadplex close to downtown and Texas Tech. Located in South Overton neighborhood, this property offers four 1bed 1bath units and Off street parking. Units 2&3 currently leased.
For sale
Price cut: $20K (11/11)
$260,000
1708 14th St, Lubbock, TX 79401
4beds
2,800sqft
Quadruplex, Multi Family
Built in 1940
-- sqft lot
$-- Zestimate®
$93/sqft
$-- HOA
What's special
Off street parking
- 30 days
- 203
- 15
Zillow last checked:
Listing updated:
Listed by:
Justin Wright TREC #0619932 806-441-3175,
Reside Real Estate Co.
Source: LBMLS,MLS#: 202614175
Facts & features
Interior
Bedrooms & bathrooms
- Bedrooms: 4
- Bathrooms: 4
- Full bathrooms: 4
Heating
- Central, Electric
Cooling
- Central Air
Interior area
- Total structure area: 2,800
- Total interior livable area: 2,800 sqft
- Finished area above ground: 2,800
Property
Parking
- Parking features: Off Street
Lot
- Size: 8,276 Square Feet
Details
- Parcel number: R136567
Construction
Type & style
- Home type: MultiFamily
- Property subtype: Quadruplex, Multi Family
Materials
- Unknown
Condition
- New construction: No
- Year built: 1940
Community & HOA
Location
- Region: Lubbock
Financial & listing details
- Price per square foot: $93/sqft
- Tax assessed value: $246,237
- Annual tax amount: $4,367
- Date on market: 10/18/2026
- Cumulative days on market: 30 days
- Listing terms: Cash,Conventional
- Road surface type: Asphalt
Estimated market value
Not available
Estimated sales range
Not available
$947/mo
Price history
| Date | Event | Price |
|---|---|---|
| 11/11/2026 | Price change | $260,000-7.1%$93/sqft |
Source:  LBMLS #202614175 Report a problem | ||
| 10/18/2026 | Listed for sale | $280,000+273.3%$100/sqft |
Source: LBMLS #202614175 Report a problem | ||
| 10/9/2026 | Listing removed | $895 |
Source: Zillow Rentals Report a problem | ||
| 3/25/2026 | Listed for rent | $895 |
Source: Zillow Rentals Report a problem | ||
| 4/5/2016 | Sold | -- |
Source: Agent Provided Report a problem | ||
| 2/28/2011 | Listing removed | $75,000$27/sqft |
Source: RebuildUS LLC Report a problem | ||
| 2/25/2011 | Listed for sale | $75,000+1.4%$27/sqft |
Source: RebuildUS LLC Report a problem | ||
| 1/16/2011 | Listing removed | $74,000$26/sqft |
Source: Systems Engineering, Inc. #9977438 Report a problem | ||
| 1/11/2011 | Listed for sale | $74,000+1.6%$26/sqft |
Source: Systems Engineering, Inc. #9977438 Report a problem | ||
| 1/7/2011 | Sold | -- |
Source: Public Record Report a problem | ||
| 11/13/2010 | Price change | $72,810-10%$26/sqft |
Source: Fannie Mae Report a problem | ||
| 10/22/2010 | Price change | $80,900-10.2%$29/sqft |
Source: Fannie Mae Report a problem | ||
| 9/17/2010 | Price change | $90,100-10%$32/sqft |
Source: Fannie Mae Report a problem | ||
| 8/14/2010 | Price change | $100,100$36/sqft |
Source: Fannie Mae Report a problem | ||
| 8/6/2010 | Listed for sale | -- |
Source: foreclosure.com Report a problem | ||
| 4/15/2010 | Sold | -- |
Source: Public Record Report a problem | ||
Public tax history
| Year | Property taxes | Tax assessment |
|---|---|---|
| 2026 | -- | $246,237 -0.2% |
| 2025 | $4,368 -2.6% | $246,837 |
| 2024 | $4,482 +13.7% | $246,837 +16.4% |
| 2023 | $3,943 +5.2% | $212,096 +14.6% |
| 2022 | $3,748 +19.9% | $185,145 +25.9% |
| 2021 | $3,127 -0.7% | $147,020 |
| 2020 | $3,149 +6.3% | $147,020 +7.9% |
| 2019 | $2,963 +5% | $136,240 +8.6% |
| 2018 | $2,820 | $125,459 |
| 2017 | $2,820 +23.6% | $125,459 +21% |
| 2016 | $2,283 | $103,676 +1% |
| 2014 | $2,283 | $102,654 -29.4% |
| 2013 | -- | $145,382 |
| 2012 | -- | $145,382 +164.3% |
| 2011 | -- | $55,000 -5.4% |
| 2010 | -- | $58,160 |
| 2009 | -- | $58,160 -55.9% |
| 2008 | -- | $131,773 +147.2% |
| 2007 | -- | $53,307 +5% |
| 2006 | -- | $50,751 +49.8% |
| 2005 | -- | $33,882 +10% |
| 2004 | -- | $30,802 +10% |
| 2003 | -- | $28,002 -5.1% |
| 2002 | $491 +15.4% | $29,505 -4.3% |
| 2001 | $425 +17.2% | $30,831 0% |
| 2000 | $363 | $30,832 |
Find assessor info on the county website
Monthly payment
Est. payment
Payment breakdown
Explore the cost of this home by adjusting the details. Changes won't be saved.Climate risks
Neighborhood: South Overton


Similar homes
- $310,0006 bd5 ba2.6k sqft2123 18th St, Lubbock, TX 79401For Sale
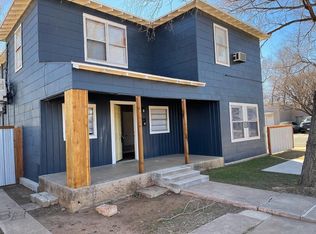 MLS ID #202615409, Travis Turner, Brick & Loft Realty. LBMLS
- $245,0005 bd3 ba2.7k sqft2420 33rd St, Lubbock, TX 79411For Sale
 MLS ID #202615410, Travis Turner, Brick & Loft Realty. LBMLS
- $225,8156 bd3 ba2.2k sqft1901 15th St, Lubbock, TX 79401For Sale
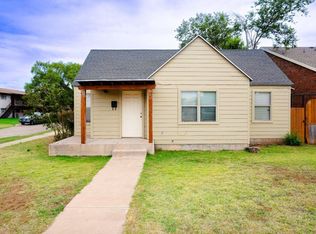 MLS ID #202609786, Chris Carter, The 32:18 Management Group. LBMLS
- $298,0004 bd6 ba4k sqft1905 15th St, Lubbock, TX 79401For Sale
 MLS ID #202609795, Chris Carter, The 32:18 Management Group. LBMLS
