Quadplex for Sale! Located within walking distance to Texas Tech you will find this nice investment property for sale. The front address is a triplex at 2123 18th. The front unit is a 3/2 that is 1382 Sq ft and is rented for $949 a month. The other 2 units are located upstairs, and are 1/1 and rents are B - Vacant, and C - $490 they both are 558 and 600 sq ft. The back unit has its own address - 1805 Ave V and it is 558 sq ft and is rented for $599 a month. Large property and tons of room to increase rents, this is a great investment property to add to a portfolio and offset some taxes!
For sale
$310,000
2123 18th St, Lubbock, TX 79401
6beds
2,656sqft
Quadruplex, Multi Family
Built in 1934
-- sqft lot
$250,400 Zestimate®
$117/sqft
$-- HOA
What's special
- 3 hours
- 20
- 3
Zillow last checked:
Listing updated:
Listed by:
Travis Turner TREC #0660475 806-577-2508,
Brick & Loft Realty
Source: LBMLS,MLS#: 202615409
Facts & features
Interior
Bedrooms & bathrooms
- Bedrooms: 6
- Bathrooms: 5
- Full bathrooms: 5
Heating
- Central, Ductless, Electric, Natural Gas
Cooling
- Ceiling Fan(s), Central Air, Ductless, Wall/Window Unit(s)
Appliances
- Included: Refrigerator
Features
- Ceiling Fan(s)
- Flooring: Luxury Vinyl
Interior area
- Total structure area: 2,656
- Total interior livable area: 2,656 sqft
- Finished area above ground: 2,656
Property
Parking
- Parking features: Additional Parking, Driveway, Off Street, On Street
- Has uncovered spaces: Yes
Features
- Fencing: Back Yard,Wood
Lot
- Size: 9,147 Square Feet
Details
- Parcel number: R38807
- Special conditions: Standard
Construction
Type & style
- Home type: MultiFamily
- Property subtype: Quadruplex, Multi Family
Materials
- Asbestos
- Roof: Composition
Condition
- New construction: No
- Year built: 1934
Community & HOA
Community
- Security: Carbon Monoxide Detector(s), Smoke Detector(s)
HOA
- Has HOA: No
Location
- Region: Lubbock
Financial & listing details
- Price per square foot: $117/sqft
- Tax assessed value: $234,048
- Annual tax amount: $3,855
- Date on market: 11/17/2026
- Cumulative days on market: 1 day
- Listing terms: Cash,Conventional
- Road surface type: All Weather
Estimated market value
$250,400
$225,000 - $278,000
$1,078/mo
Price history
| Date | Event | Price |
|---|---|---|
| 11/17/2026 | Listed for sale | $310,000+8.8%$117/sqft |
Source:  LBMLS #202615409 Report a problem | ||
| 7/1/2026 | Listing removed | $949 |
Source: Zillow Rentals Report a problem | ||
| 6/3/2026 | Price change | $949-5% |
Source: Zillow Rentals Report a problem | ||
| 4/20/2026 | Price change | $999-4.8% |
Source: Zillow Rentals Report a problem | ||
| 4/17/2026 | Price change | $1,049-4.5% |
Source: Zillow Rentals Report a problem | ||
| 3/18/2026 | Listed for rent | $1,099 |
Source: Zillow Rentals Report a problem | ||
| 6/10/2024 | Sold | -- |
Source: LBMLS #202404235 Report a problem | ||
| 4/15/2024 | Pending sale | $285,000$107/sqft |
Source: LBMLS #202404235 Report a problem | ||
| 3/29/2024 | Listed for sale | $285,000-8.1%$107/sqft |
Source: LBMLS #202404235 Report a problem | ||
| 1/3/2024 | Listing removed | -- |
Source: LBMLS #202315876 Report a problem | ||
| 12/11/2023 | Price change | $310,000-4.6%$117/sqft |
Source: LBMLS #202315876 Report a problem | ||
| 10/25/2023 | Listed for sale | $325,000-3%$122/sqft |
Source: LBMLS #202315876 Report a problem | ||
| 10/1/2023 | Listing removed | -- |
Source: LBMLS #202305781 Report a problem | ||
| 9/28/2023 | Pending sale | $335,000$126/sqft |
Source: LBMLS #202305781 Report a problem | ||
| 6/3/2023 | Listed for sale | $335,000$126/sqft |
Source: LBMLS #202305781 Report a problem | ||
| 5/24/2023 | Pending sale | $335,000$126/sqft |
Source: LBMLS #202305781 Report a problem | ||
| 5/3/2023 | Price change | $335,000+1.5%$126/sqft |
Source: LBMLS #202305781 Report a problem | ||
| 12/30/2022 | Listed for sale | $330,000$124/sqft |
Source: LBMLS #202213976 Report a problem | ||
Public tax history
| Year | Property taxes | Tax assessment |
|---|---|---|
| 2026 | -- | $234,048 +7.4% |
| 2025 | $3,855 +4.6% | $217,852 +7.3% |
| 2024 | $3,686 -4.6% | $202,995 -10.5% |
| 2023 | $3,862 -9.8% | $226,748 +7.2% |
| 2022 | $4,280 +25% | $211,435 +26% |
| 2021 | $3,423 +9.4% | $167,867 +14.9% |
| 2020 | $3,128 +8.3% | $146,050 +10% |
| 2019 | $2,887 +5.3% | $132,764 +8.8% |
| 2018 | $2,743 | $122,007 |
| 2017 | $2,743 +16.9% | $122,007 +11.8% |
| 2016 | $2,346 | $109,095 +3.9% |
| 2015 | $2,346 | $104,977 -0.5% |
| 2014 | $2,346 | $105,500 +5.5% |
| 2013 | -- | $100,000 |
| 2012 | -- | $100,000 |
| 2011 | -- | $100,000 |
| 2010 | -- | $100,000 |
| 2009 | -- | $100,000 +11.1% |
| 2008 | -- | $90,000 |
| 2007 | -- | $90,000 -11.8% |
| 2006 | -- | $102,000 +10.5% |
| 2005 | -- | $92,299 -3.9% |
| 2004 | -- | $96,061 +64.8% |
| 2003 | -- | $58,301 +11.7% |
| 2002 | $1,294 -12.5% | $52,199 -12.6% |
| 2001 | $1,478 +10% | $59,729 +9.2% |
| 2000 | $1,344 | $54,710 |
Find assessor info on the county website
Monthly payment
Est. payment
Payment breakdown
Explore the cost of this home by adjusting the details. Changes won't be saved.Climate risks
Neighborhood: South Overton


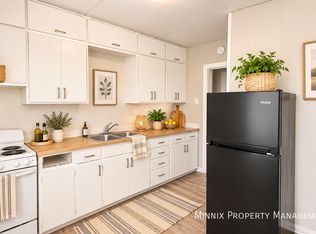
Similar homes
- $348,6486 bd6 ba3.4k sqft2217 15th St, Lubbock, TX 79401For Sale
 MLS ID #202609791, Chris Carter, The 32:18 Management Group. LBMLS
- $245,0005 bd3 ba2.7k sqft2420 33rd St, Lubbock, TX 79411For Sale
 MLS ID #202615410, Travis Turner, Brick & Loft Realty. LBMLS
- $349,0006 bd6 ba3.4k sqft1908 15th St, Lubbock, TX 79401For Sale
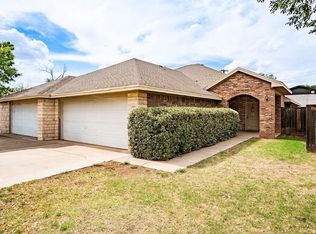 MLS ID #202609798, Chris Carter, The 32:18 Management Group. LBMLS
- $278,9508 bd4 ba3.3k sqft1609 44th St, Lubbock, TX 79412For Sale
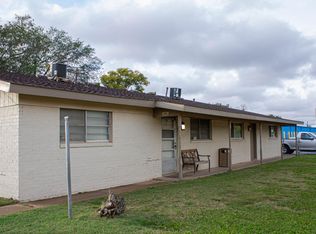 MLS ID #202615383, Doug Duncan, Real Broker, LLC. LBMLS
