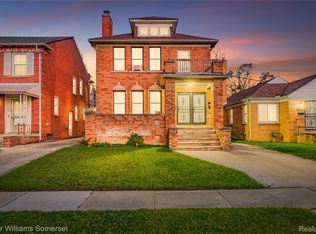
SHOWN UPON ACCEPTED OFFER ONLY. Solid brick 2-unit duplex, fully leased and professionally managed. One unit is 3 bed/1 bath, the other 2 bed/1 bath, plus basement. Rents today total $1,649/mo, well below market. At market rent of approx $1,200/unit, the projected cap rate is approx 6.5% (est. after actual taxes of $8,286/yr, 10% vacancy, 10% management, insurance and reserves; buyer to verify). Lower unit is month to month and can go to market now; upper lease ends 4/30/27. Newer furnaces, updated PEX plumbing and updated electrical. City of Detroit Certificate of Compliance on file through 08/01/2029, so no city compliance work needed for years. Leases and ledgers provided after accepted offer. Cash or conventional only. *Do not disturb tenants. Do NOT email offers; offer instructions and submission link are in ShowingTime and agent remarks.
For sale
$179,500
17328 Indiana St, Detroit, MI 48221
5beds
2,321sqft
Multi Family
Built in 1928
-- sqft lot
$-- Zestimate®
$77/sqft
$-- HOA
What's special
- 160 days
- 276
- 39
Zillow last checked:
Listing updated:
Listed by:
Carlo Gobba 888-501-7085,
EXP Realty Main 888-501-7085
Source: Realcomp II,MLS#: 20261041442
Facts & features
Interior
Bedrooms & bathrooms
- Bedrooms: 5
- Bathrooms: 2
- Full bathrooms: 2
Heating
- Forced Air, Natural Gas
Features
- Basement: Unfinished
- Has fireplace: No
Interior area
- Total interior livable area: 2,321 sqft
- Finished area above ground: 2,321
Property
Features
- Levels: Two
- Stories: 2
- Pool features: None
Lot
- Size: 4,791 Square Feet
- Dimensions: 40 x 114.02
Details
- Parcel number: W16I035668S
- Zoning description: Residential
- Special conditions: Corporate Relocation,Short Sale No
Construction
Type & style
- Home type: MultiFamily
- Architectural style: Colonial
- Property subtype: Multi Family
Materials
- Brick
- Foundation: Basement, Block
Condition
- New construction: No
- Year built: 1928
Utilities & green energy
- Sewer: Public Sewer
- Water: Public
Community & HOA
Community
- Subdivision: SANTA MARIA PARK SUB
Location
- Region: Detroit
Financial & listing details
- Price per square foot: $77/sqft
- Tax assessed value: $94,336
- Annual tax amount: $8,286
- Date on market: 6/8/2026
- Cumulative days on market: 160 days
- Listing agreement: Exclusive Right To Sell
- Listing terms: Cash,Conventional
Estimated market value
Not available
Estimated sales range
Not available
$1,215/mo
Price history
| Date | Event | Price |
|---|---|---|
| 11/9/2026 | Listed for rent | $999+2.5% |
Source: Zillow Rentals Report a problem | ||
| 7/29/2026 | Price change | $179,500-5.5%$77/sqft |
Source:  Realcomp II #20261041442 Report a problem | ||
| 6/9/2026 | Listed for sale | $190,000$82/sqft |
Source: Realcomp II #20261041442 Report a problem | ||
| 2/28/2024 | Listing removed | -- |
Source: Zillow Rentals Report a problem | ||
| 2/5/2024 | Listed for rent | $975 |
Source: Zillow Rentals Report a problem | ||
| 10/18/2023 | Listing removed | -- |
Source: Zillow Rentals Report a problem | ||
| 8/31/2023 | Price change | $975-2.5% |
Source: Zillow Rentals Report a problem | ||
| 5/21/2023 | Listed for rent | $1,000 |
Source: Zillow Rentals Report a problem | ||
| 4/28/2023 | Sold | $190,000+72.7%$82/sqft |
Source: Public Record Report a problem | ||
| 12/1/2022 | Sold | $110,000-24.7%$47/sqft |
Source: Realcomp II #20221022694 Report a problem | ||
| 11/15/2022 | Pending sale | $145,999$63/sqft |
Source: Realcomp II #20221022694 Report a problem | ||
| 9/23/2022 | Listed for sale | $145,999$63/sqft |
Source: Realcomp II #20221022694 Report a problem | ||
| 8/6/2022 | Pending sale | $145,999$63/sqft |
Source: Realcomp II #20221022694 Report a problem | ||
| 7/30/2022 | Listed for sale | $145,999+12.3%$63/sqft |
Source: Realcomp II #20221022694 Report a problem | ||
| 1/3/2022 | Listing removed | -- |
Source: Realcomp II #2210091462 Report a problem | ||
| 12/19/2021 | Pending sale | $130,000$56/sqft |
Source: Realcomp II #2210091462 Report a problem | ||
| 12/19/2021 | Listing removed | $130,000$56/sqft |
Source: Realcomp II #2210091462 Report a problem | ||
| 11/29/2021 | Listed for sale | $130,000-7.1%$56/sqft |
Source: Realcomp II #2210091462 Report a problem | ||
| 10/24/2018 | Sold | $140,000+723.5%$60/sqft |
Source: Public Record Report a problem | ||
| 3/5/2014 | Sold | $17,000-8.1%$7/sqft |
Source: Public Record Report a problem | ||
| 1/17/2014 | Price change | $18,500-9.8%$8/sqft |
Source: MCNEAL OBRIEN TEAM LLC #213117367 Report a problem | ||
| 11/16/2013 | Listed for sale | $20,500-74.3%$9/sqft |
Source: MCNEAL OBRIEN TEAM LLC #213117367 Report a problem | ||
| 1/4/2013 | Sold | $79,698$34/sqft |
Source: Public Record Report a problem | ||
Public tax history
| Year | Property taxes | Tax assessment |
|---|---|---|
| 2026 | -- | $115,800 +11.3% |
| 2025 | -- | $104,000 +43.1% |
| 2024 | -- | $72,700 +39.5% |
| 2023 | -- | $52,100 +35% |
| 2022 | -- | $38,600 +21% |
| 2021 | -- | $31,900 |
| 2020 | $1,418 -15.2% | $31,900 +27.6% |
| 2019 | $1,671 | $25,000 +18.5% |
| 2018 | $1,671 | $21,100 +8.8% |
| 2017 | -- | $19,400 -44.1% |
| 2016 | $2,236 | $34,700 +97.2% |
| 2015 | $2,236 +1.6% | $17,600 -20% |
| 2013 | $2,200 -1.6% | $22,003 -28% |
| 2010 | $2,236 | $30,540 -18% |
| 2009 | -- | $37,244 -14.5% |
| 2008 | -- | $43,560 |
| 2007 | -- | $43,560 +5.5% |
| 2005 | $257 | $41,289 +3% |
| 2004 | -- | $40,086 +108.9% |
| 2001 | $1,598 +10.1% | $19,191 +3.2% |
| 2000 | $1,451 | $18,596 |
Find assessor info on the county website
Monthly payment
Est. payment
Payment breakdown
Explore the cost of this home by adjusting the details. Changes won't be saved.Climate risks
Neighborhood: Bagley


Similar homes
- $155,0005 bd2 ba2.2k sqft9242 Appoline St, Detroit, MI 48228For Sale
 MLS ID #20261087984, James T Silver, Keller Williams Somerset. Realcomp II
- $150,0006 bd4 ba2.6k sqft16188 Lawton St, Detroit, MI 48221For Sale
 MLS ID #20261022162, Jacob Farrelly, DOBI Real Estate. Realcomp II
- $155,0006 bd2 ba1.9k sqft14075 Northlawn St, Detroit, MI 48238For Sale
 MLS ID #20261090079, Heather Dell, RE/MAX Leading Edge. Realcomp II
- $189,9004 bd2 ba2.1k sqft14720 Winthrop St, Detroit, MI 48227For Sale
 MLS ID #20261062059, Omar Ghazzawi, Keller Williams Legacy. Realcomp II
- $210,0005 bd3 ba2.8k sqft13340 Hartwell St, Detroit, MI 48227For SaleMLS ID #20261078925, Ligia M Godoy, CMB Real Estate. Realcomp II
- $189,9004 bd3 ba2.8k sqft16900 Rockdale St, Detroit, MI 48219For SaleMLS ID #20261092230, Dwala Burk, DK Caldwell Real Estate Professionals LLC. Realcomp II
- $160,8753 bd2 ba1.8k sqft17593 Monica St, Detroit, MI 48221For Sale
 MLS ID #25044558, Charles Campbell, ListWithFreedom.com. MichRIC
- $193,0006 bd3 ba2.6k sqft2988 Richton St, Detroit, MI 48206For SaleMLS ID #20261062642, Antwuan M Hawkins, Five Star Luxury Realty. Realcomp II
- $159,0005 bd3 ba2.6k sqft3810 Tyler St, Detroit, MI 48238For SaleMLS ID #20261040655, Zaquay M Edwards, KW Metro. Realcomp II
- $155,0006 bd3 ba2.8k sqft2964 Leslie St, Detroit, MI 48238For SaleMLS ID #20261073485, Justin S Ford, EXP Realty Plymouth. Realcomp II
- $179,5004 bd3 ba1.9k sqft4348 Sturtevant St, Detroit, MI 48204For SaleMLS ID #26049639, Anita Martin, Team LBR LLC. MichRIC
- $199,0006 bd4 ba3.4k sqft3275 Webb St, Detroit, MI 48206For SaleMLS ID #26046733, Gustaf Andreasen, @properties Christie's Int'l. MichRIC
- $140,0005 bd3 ba2.6k sqft4066 Tyler St, Detroit, MI 48238For SaleMLS ID #20261081011, Jessica Curmi, Clyde Realty LLC. Realcomp II
- $199,9006 bd3 ba2.5k sqft5106-5108 S Martindale St, Detroit, MI 48204For SaleMLS ID #20261045457, Juan P Clavon, A Star National Realty. Realcomp II
- $135,0004 bd2 ba2.1k sqft13523 Santa Rosa Dr, Detroit, MI 48238For SaleMLS ID #20261088621, Heather Dell, RE/MAX Leading Edge. Realcomp II
- $135,0004 bd2 ba2.2k sqft12722 Stoepel St, Detroit, MI 48238For SaleMLS ID #20261088531, Heather Dell, RE/MAX Leading Edge. Realcomp II
- $164,9003 bd2 ba1.3k sqft293 Fielding St, Ferndale, MI 48220For SaleMLS ID #20261091792, John Graham, John Graham Realty, LLC. Realcomp II
- $152,0003 bd1 ba1.3k sqft16576 Ilene St, Detroit, MI 48221For SaleMLS ID #20261058049, Franco Moncada, RE/MAX Showcase Homes. Realcomp II
- $191,0003 bd2 ba1.5k sqft14936 Ashton Rd, Detroit, MI 48223For SaleMLS ID #20261090290, Costello Hickson III, Front Page Properties. Realcomp II
