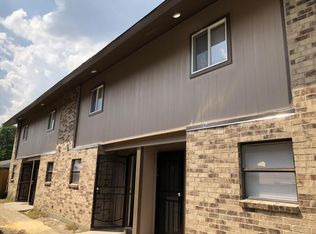
Prime Investment Opportunity — Fully Gutted Fourplex in East Baton Rouge!
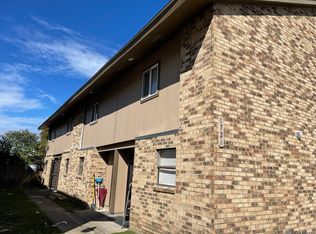
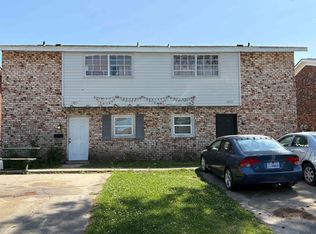
Discover the potential of this South Highland Industrial Park fourplex, featuring 8 bedrooms and 8 bathrooms across two-story units, offering flexible and efficient layouts for future tenants. The property has been fully gutted, making it the perfect blank canvas for a full renovation or repositioning project.
Whether you're an experienced investor or a developer seeking your next value-add opportunity, this property delivers outstanding upside in a growing market.
Active
$169,000
1736 Mast Dr, Baton Rouge, LA 70820
8beds
4,300sqft
Quadruplex, Multi Family, Multi Family
Built in 1980
-- sqft lot
$-- Zestimate®
$39/sqft
$-- HOA
What's special
Two-story unitsFlexible and efficient layouts
- 221 days |
- 309 |
- 11 |
Zillow last checked:
Listing updated:
Listed by:
Brandin Learson 504-319-4734,
Branding Realty LLC 504-319-4734
Source: GSREIN,MLS#: 2531668
Loading...
Facts & features
Interior
Bedrooms & bathrooms
- Bedrooms: 8
- Bathrooms: 8
- Full bathrooms: 8
Heating
- None
Cooling
- None
Interior area
- Total interior livable area: 4,300 sqft
Property
Parking
- Parking features: Driveway, Off Street
- Has uncovered spaces: Yes
Features
- Levels: Two
- Stories: 2
- Pool features: None
Lot
- Size: 8,400 Square Feet
- Dimensions: 60 x 140
- Features: City Lot, Rectangular Lot
Details
- Parcel number: 1736MASTDR
- Special conditions: None
Construction
Type & style
- Home type: MultiFamily
- Architectural style: Other
- Property subtype: Quadruplex, Multi Family, Multi Family
Materials
- Brick, HardiPlank Type
- Foundation: Slab
- Roof: Shingle
Condition
- Average Condition
- Year built: 1980
Utilities & green energy
- Sewer: Public Sewer
- Water: Public
Community & HOA
Location
- Region: Baton Rouge
Financial & listing details
- Price per square foot: $39/sqft
- Tax assessed value: $160,000
- Annual tax amount: $2,013
- Date on market: 11/19/2025
- Tenant pays: Electricity, Gas, Water
Estimated market value
Not available
Estimated sales range
Not available
$1,028/mo
Price history
| Date | Event | Price |
|---|---|---|
| 11/19/2025 | Listed for sale | $169,000-11.1%$39/sqft |
Source: | ||
| 4/19/2025 | Listing removed | $189,999$44/sqft |
Source: | ||
| 2/4/2025 | Listed for sale | $189,999$44/sqft |
Source: | ||
| 1/21/2025 | Pending sale | $189,999$44/sqft |
Source: | ||
| 10/21/2024 | Price change | $189,999-5%$44/sqft |
Source: | ||
| 9/16/2024 | Price change | $199,999-11.1%$47/sqft |
Source: | ||
| 7/8/2024 | Listed for sale | $225,000-97.8%$52/sqft |
Source: | ||
| 12/16/2016 | Sold | -- |
Source: | ||
| 7/5/2016 | Pending sale | $10,000,000$2,326/sqft |
Source: Xome Distressed #P1114NN Report a problem | ||
| 6/28/2016 | Listed for sale | $10,000,000$2,326/sqft |
Source: Xome Distressed #P1114NN Report a problem | ||
| 12/7/2005 | Sold | -- |
Source: Public Record Report a problem | ||
| 8/28/2003 | Sold | -- |
Source: Public Record Report a problem | ||
| 6/12/2001 | Sold | -- |
Source: Public Record Report a problem | ||
Public tax history
| Year | Property taxes | Tax assessment |
|---|---|---|
| 2025 | $2,013 -0.4% | $16,000 |
| 2024 | $2,022 +36.7% | $16,000 +41.8% |
| 2023 | $1,479 +2.9% | $11,280 |
| 2022 | $1,437 +1.8% | $11,280 |
| 2021 | $1,412 +0.9% | $11,280 |
| 2020 | $1,400 +5% | $11,280 +10% |
| 2019 | $1,333 +1.2% | $10,250 |
| 2018 | $1,317 | $10,250 |
| 2017 | $1,317 | $10,250 |
| 2016 | $1,317 +2.4% | $10,250 +2.5% |
| 2015 | $1,287 +4.4% | $10,000 |
| 2014 | $1,232 | $10,000 |
| 2013 | $1,232 | $10,000 |
| 2012 | $1,232 -0.8% | $10,000 |
| 2011 | $1,242 -17.4% | $10,000 -20% |
| 2010 | $1,504 | $12,500 |
Find assessor info on the county website
Monthly payment
Est. payment$--/mo
Payment breakdown
Explore the cost of this home by adjusting the details. Changes won't be saved.All calculations are estimates and provided by Zillow, Inc. for informational purposes only. Actual amounts may vary.
HOA fees may include property taxes on listings classified as Co-Ops. Contact the listing agent and/or owner for fee details.
Mortgage interest rates are dependent on a number of factors, including credit score, down payment, and repayment length. Interest rate data provided by Zillow Group Marketplace, Inc. as of 1/1/1970 from various mortgage lenders with which we have lead or other similar arrangements; the Estimated Payment is an average of those rates.
See how much you could borrow to make a competitive offer.
Climate risks
Neighborhood: South Burbank
Nearby schools
GreatSchools rating
- 7/10Magnolia Woods Elementary SchoolGrades: PK-5Distance: 1.9 mi
- 6/10Glasgow Middle SchoolGrades: 6-8Distance: 3.6 mi
- 2/10Mckinley Senior High SchoolGrades: 9-12Distance: 5.1 mi
A local agent can set up tours, give advice and negotiate with sellers.
A local lender can help you make sure your offer is ready when you are.


Nearby cities
Nearby neighborhoods
Nearby zip codes
Other Baton Rouge Topics
