Charming 2-bedroom, 1-bath home tucked away on a peaceful street. It offers a cozy feel and comfortable living spaces you'll love coming home to. Enjoy peace of mind with the big-ticket items already taken care of: the roof, central air, and furnace were all replaced about 4.5 years ago. Commuters will appreciate quick access to I-75, putting shopping, dining, and work within easy reach.
Active contingent
$145,000
1752 E Milton Ave, Hazel Park, MI 48030
2beds
750sqft
Single Family Residence
Built in 1952
4,356 Square Feet Lot
$143,400 Zestimate®
$193/sqft
$-- HOA
What's special
Peaceful street
- 20 days
- 286
- 57
Zillow last checked:
Listing updated:
Listed by:
Jason Um 734-649-2460,
Catalyst Management Services 734-649-2460
Source: MichRIC,MLS#: 26055201
Facts & features
Interior
Bedrooms & bathrooms
- Bedrooms: 2
- Bathrooms: 1
- Full bathrooms: 1
- Main level bedrooms: 2
Heating
- Forced Air
Cooling
- Central Air
Appliances
- Included: Dishwasher, Dryer, Oven, Range, Refrigerator, Washer
- Laundry: In Basement
Features
- Flooring: Wood
- Basement: Full
- Has fireplace: No
Interior area
- Total structure area: 750
- Total interior livable area: 750 sqft
- Finished area below ground: 0
Property
Parking
- Total spaces: 1
- Parking features: Detached
- Garage spaces: 1
Features
- Stories: 1
Lot
- Size: 4,356 Square Feet
- Dimensions: 40' x 108'
Details
- Parcel number: 2536480007
Construction
Type & style
- Home type: SingleFamily
- Architectural style: Ranch
- Property subtype: Single Family Residence
Materials
- Vinyl Siding
- Roof: Shingle
Condition
- New construction: No
- Year built: 1952
Utilities & green energy
- Sewer: Public Sewer
- Water: Public
Community & HOA
Location
- Region: Hazel Park
Financial & listing details
- Price per square foot: $193/sqft
- Tax assessed value: $41,470
- Annual tax amount: $3,903
- Date on market: 10/16/2026
- Listing terms: Cash,Conventional
- Road surface type: Paved
Estimated market value
$143,400
$136,000 - $151,000
$1,307/mo
Price history
| Date | Event | Price |
|---|---|---|
| 10/31/2026 | Contingent | $145,000$193/sqft |
Source:  MichRIC #26055201 Report a problem | ||
| 10/16/2026 | Listed for sale | $145,000-2%$193/sqft |
Source: MichRIC #26055201 Report a problem | ||
| 2/16/2022 | Sold | $148,000-1.3%$197/sqft |
Source: Public Record Report a problem | ||
| 1/9/2022 | Pending sale | $149,900$200/sqft |
Source:  Realcomp II #2210100048 Report a problem | ||
| 12/10/2021 | Listed for sale | $149,900+109.7%$200/sqft |
Source: Realcomp II #2210100048 Report a problem | ||
| 9/21/2021 | Sold | $71,500-4.7%$95/sqft |
Source: Public Record Report a problem | ||
| 9/2/2021 | Pending sale | $75,000$100/sqft |
Source: Realcomp II #2210063467 Report a problem | ||
| 8/30/2021 | Price change | $75,000-15.3%$100/sqft |
Source: Realcomp II #2210063467 Report a problem | ||
| 8/12/2021 | Listed for sale | $88,500+22.9%$118/sqft |
Source: Realcomp II #2210063467 Report a problem | ||
| 3/6/2020 | Listing removed | $72,000$96/sqft |
Source: National Realty Centers Birmingham #2200016547 Report a problem | ||
| 3/3/2020 | Price change | $72,000-7.7%$96/sqft |
Source: National Realty Centers Birmingham #2200016547 Report a problem | ||
| 2/29/2020 | Listed for sale | $78,000+654.9%$104/sqft |
Source: National Realty Centers Birmingham #2200016547 Report a problem | ||
| 12/23/2009 | Sold | $10,333+3.3%$14/sqft |
Source: Public Record Report a problem | ||
| 9/20/2009 | Listing removed | $10,000$13/sqft |
Source: foreclosure.com Report a problem | ||
| 9/7/2009 | Listed for sale | $10,000-89.9%$13/sqft |
Source: foreclosure.com Report a problem | ||
| 1/15/2008 | Sold | $98,646+12.1%$132/sqft |
Source: Public Record Report a problem | ||
| 9/26/2001 | Sold | $88,000+60%$117/sqft |
Source: Public Record Report a problem | ||
| 3/5/1998 | Sold | $55,000$73/sqft |
Source: Public Record Report a problem | ||
Public tax history
| Year | Property taxes | Tax assessment |
|---|---|---|
| 2025 | $3,739 +21.9% | $47,750 +10.6% |
| 2024 | $3,067 +12.7% | $43,190 +12.7% |
| 2023 | $2,721 +92.3% | $38,320 +13.9% |
| 2022 | $1,415 +0.4% | $33,650 +37.5% |
| 2021 | $1,409 | $24,480 +16.5% |
| 2020 | -- | $21,020 +13.9% |
| 2019 | $2,806 +111.5% | $18,460 +12.8% |
| 2018 | $1,326 0% | $16,360 +7% |
| 2017 | $1,327 | $15,290 +13.3% |
| 2016 | $1,327 | $13,490 +14% |
| 2015 | -- | $11,830 +6.2% |
| 2014 | -- | $11,140 -34.2% |
| 2011 | -- | $16,920 -27.4% |
| 2010 | $2,119 -8.6% | $23,300 -31.5% |
| 2009 | $2,317 +48.8% | $34,000 -58% |
| 2005 | $1,558 | $80,890 +92.9% |
| 2003 | -- | $41,940 +21.4% |
| 2002 | -- | $34,550 +35.1% |
| 2001 | $1,541 +4.3% | $25,580 +3.2% |
| 2000 | $1,478 | $24,790 |
Find assessor info on the county website
Monthly payment
Est. payment
Payment breakdown
Explore the cost of this home by adjusting the details. Changes won't be saved.Climate risks
Neighborhood: 48030


Similar homes
- $124,9002 bd1 ba700 sqft1527 E Meyers Ave, Hazel Park, MI 48030For Sale
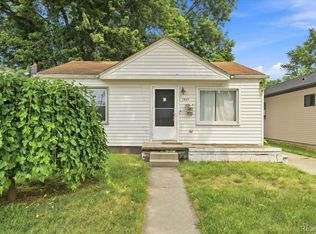
 MLS ID #20261088918, LaCretia Baldwin, EXP Realty Main. Realcomp II
- $150,0004 bd1 ba1k sqft1645 E Evelyn Ave, Hazel Park, MI 48030For Sale
 MLS ID #20261084087, Jim Shaffer, Good Company. Realcomp II
- $139,9002 bd1 ba708 sqft1412 E Woodruff Ave, Hazel Park, MI 48030For Sale
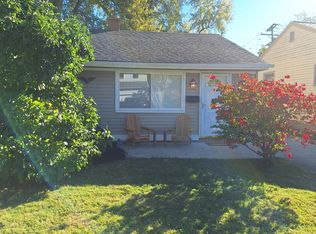 MLS ID #20261084965, Jeff Hedberg, Real Estate Masters. Realcomp II
- $--3 bd1 ba980 sqft23122 Crossley Ave, Hazel Park, MI 48030Auction
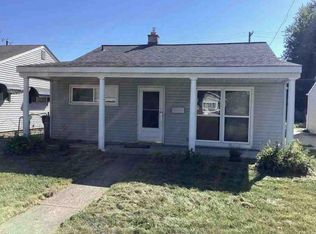 Auction.com 1
- $139,9002 bd1 ba738 sqft586 E Hayes Ave, Hazel Park, MI 48030For Sale
 MLS ID #50224305, Bradley LaBrie, Keller Williams First. MiRealSource
- $134,0002 bd1 ba707 sqft1446 E Meyers Ave, Hazel Park, MI 48030For SaleMLS ID #20261076268, Leanne Smits, Real Estate One-Royal Oak. Realcomp II
- $140,0003 bd1 ba975 sqft1636 E Pearl Ave, Hazel Park, MI 48030For Sale
 MLS ID #26046868, Keith Jourdan, Preferred, Realtors Ltd. MichRIC
- $105,0003 bd1 ba844 sqft1731 E Pearl Ave, Hazel Park, MI 48030For SaleMLS ID #20261087079, Joshua Hepner, Keller Williams Somerset. Realcomp II
- $100,0002 bd1 ba907 sqft395 W Elza Ave, Hazel Park, MI 48030For SaleMLS ID #20261088988, Antonia Aodish, EXP Realty - The Bas Group. Realcomp II
- $155,0003 bd1 ba1k sqft1026 E Evelyn Ave, Hazel Park, MI 48030For SaleMLS ID #20261064725, Heather Castelli, The Home Store Inc.. Realcomp II
- $129,9002 bd1 ba692 sqft62 W Hayes Ave, Hazel Park, MI 48030For SaleMLS ID #20261070733, Heather S Poyhonen, Avenue Group Homes, LLC. Realcomp II
- $109,9003 bd1 ba853 sqft23827 Reynolds Ave, Hazel Park, MI 48030For SaleMLS ID #26058024, Scott Wright, Keller Williams Metro. MichRIC
- $164,9993 bd1 ba988 sqft89 W Madge Ave, Hazel Park, MI 48030For SaleMLS ID #26051909, Kevin Norton, Pellow Realty Group. MichRIC
- $140,0001 bd1 ba801 sqft23075 Vance Ave, Hazel Park, MI 48030For SaleMLS ID #20261034256, Michael Perna, EXP Realty The Perna Team. Realcomp II
- $164,9003 bd1 ba1k sqft51 W Harry Ave, Hazel Park, MI 48030For SaleMLS ID #20261077321, Brianna Card, Blue Heron Realty. Realcomp II
- $135,0003 bd1 ba787 sqft36 W Brickley Ave, Hazel Park, MI 48030For SaleMLS ID #20261081770, Sean Shields, Max Broock, REALTORS-Royal Oak. Realcomp II
- $179,9002 bd1 ba708 sqft569 E Coy Ave, Hazel Park, MI 48030For SaleMLS ID #20261087452, John Graham, John Graham Realty, LLC. Realcomp II
- $160,0002 bd1 ba771 sqft466 W Maxlow Ave, Hazel Park, MI 48030For SaleMLS ID #26020032, Sonseeahray Harvin, Redfin Corporation. MichRIC
- $155,0003 bd1 ba1k sqft22372 Ira Blvd, Warren, MI 48091For SaleMLS ID #20261088035, Kowsar Khan, IKONIK REALTY. Realcomp II
