Income producing three family offering a desirable unit mix and strong investment potential in a well connected Paterson location. The first residence features 2 bedrooms, a spacious living area, kitchen, and direct access to the private backyard. The second and third residences each offer 2 bedroom, 1 bath, with an open kitchen/living area. Situated near Downtown Paterson, local shopping, schools, major bus routes, and Paterson Station, with nearby access to Route 20, Route 80, and the Garden State Parkway. An attractive opportunity to acquire a multifamily asset with immediate income, functional layouts, and long term upside.
For sale
$499,000
176 Beech Street, Paterson, NJ 07501
6beds
--sqft
Multi Family
Built in ----
-- sqft lot
$483,600 Zestimate®
$--/sqft
$-- HOA
What's special
Functional layouts
- 106 days
- 173
- 8
Zillow last checked:
Listing updated:
Listed by:
Mordy Abelesz,
EXP Realty, LLC
Source: eXp Realty,MLS#: 26025934
Facts & features
Interior
Bedrooms & bathrooms
- Bedrooms: 6
- Bathrooms: 3
- Full bathrooms: 3
Appliances
- Laundry: None
Property
Details
- Parcel number: 0806007000000010
Construction
Type & style
- Home type: MultiFamily
- Architectural style: 3 Family
- Property subtype: Multi Family
Utilities & green energy
- Utilities for property: See Remarks
Community & HOA
Location
- Region: Paterson
Financial & listing details
- Tax assessed value: $210,100
- Annual tax amount: $11,208
- Date on market: 7/8/2026
- Listing agreement: Exclusive Right To Sell
Estimated market value
$483,600
$459,000 - $508,000
$2,002/mo
Price history
| Date | Event | Price |
|---|---|---|
| 7/16/2026 | Listed for sale | $499,000+58.4% |
Source:  GSMLS #4041262 Report a problem | ||
| 3/24/2022 | Sold | $315,000-10% |
Source: GSMLS #3753845 Report a problem | ||
| 3/16/2022 | Contingent | $350,000 |
Source:  NJMLS #21046251 Report a problem | ||
| 11/29/2021 | Listed for sale | $350,000 |
Source: GSMLS #3753845 Report a problem | ||
Public tax history
| Year | Property taxes | Tax assessment |
|---|---|---|
| 2025 | $10,705 +3.9% | $210,100 |
| 2024 | $10,301 +1.8% | $210,100 |
| 2023 | $10,121 +7.6% | $210,100 |
| 2022 | $9,404 | $210,100 |
| 2021 | $9,404 +10.8% | $210,100 |
| 2020 | $8,491 +7.4% | $210,100 +2.3% |
| 2019 | $7,904 +4.8% | $205,400 +12.4% |
| 2018 | $7,542 -9.3% | $182,700 +0.8% |
| 2017 | $8,314 +5.6% | $181,300 -5.4% |
| 2016 | $7,871 -2.3% | $191,600 |
| 2015 | $8,059 +5.7% | $191,600 -31.1% |
| 2014 | $7,626 -7.5% | $277,900 -15.2% |
| 2012 | $8,247 +18.3% | $327,900 |
| 2011 | $6,971 +10.1% | $327,900 |
| 2010 | $6,332 | $327,900 |
| 2009 | -- | $327,900 |
| 2008 | -- | $327,900 |
| 2007 | -- | $327,900 |
Find assessor info on the county website
Monthly payment
Est. payment
Payment breakdown
Explore the cost of this home by adjusting the details. Changes won't be saved.Climate risks
Neighborhood: Sandy Hill


Similar homes
- $499,0005 bd3 ba-- sqft165 Pearl Street, Paterson, NJ 07501For Sale
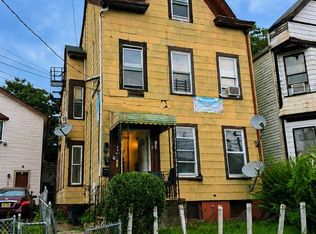 MLS ID #26030581, Mordy Abelesz. eXp Realty
- $550,0008 bd3 ba-- sqft78 16Th Ave, Paterson City, NJ 07501For Sale
 MLS ID #4028990, Anibal L. Niebla, Access Home Realty. GSMLS
- $598,0006 bd3 ba-- sqft233 Straight, Paterson, NJ 07501For Sale
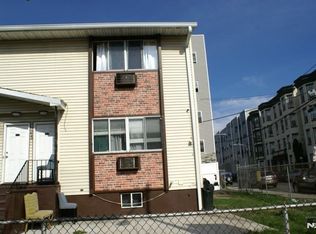
 MLS ID #26013365, Roy Castro, Realty One Group Living. NJMLS
- $635,0005 bd4 ba-- sqft1028 Madison Ave, Paterson City, NJ 07501For Sale
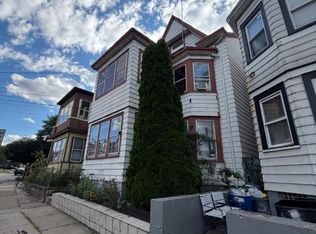 MLS ID #4049336, Nancy Pavic, Casa Real Property Group Llc. GSMLS
- $549,0003 bd1 ba-- sqft152 E Main Street, Paterson, NJ 07522For SaleMLS ID #26036842, Carly Restrepo, Coldwell Banker, Rockaway. NJMLS
