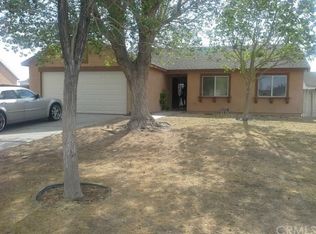
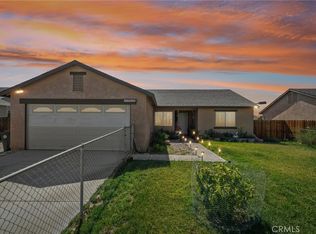
Nice Cul-de-sac Single story home with 3 bedrooms and 2 Bathrooms, Family room with fireplace, Tiles flooring thru out, kitchen area, Huge Backyard. 2 Car Garage, RV Parking.
For sale
Listed by: California Real Estate & Investments • Dinesh Mayani • 909-438-7304
$345,000
17828 Crowley St, Adelanto, CA 92301
3beds
1,265sqft
Single Family Residence
Built in 1994
0.28 Acres Lot
$346,400 Zestimate®
$273/sqft
$-- HOA
What's special
- 7 days
- 368
- 53
Likely to sell faster than
Zillow last checked:
Listing updated:
Listed by:
Dinesh Mayani DRE #01729106 909-438-7304,
California Real Estate & Investments
Source: CRMLS,MLS#: IG26243857 Originating MLS: California Regional MLS
Facts & features
Interior
Bedrooms & bathrooms
- Bedrooms: 3
- Bathrooms: 2
- Full bathrooms: 2
- Main level bathrooms: 2
- Main level bedrooms: 3
Rooms
- Room types: Bedroom
Bedroom
- Features: All Bedrooms Down
Heating
- Central
Cooling
- Central Air
Appliances
- Laundry: Inside
Features
- All Bedrooms Down
- Has fireplace: Yes
- Fireplace features: Family Room
- Common walls with other units/homes: No Common Walls
Interior area
- Total interior livable area: 1,265 sqft
Property
Parking
- Total spaces: 2
- Parking features: Garage - Attached
- Attached garage spaces: 2
Features
- Levels: One
- Stories: 1
- Entry location: 1
- Pool features: None
Lot
- Size: 0.28 Acres
- Features: Cul-De-Sac
Details
- Parcel number: 0459771200000
- Special conditions: Standard
Construction
Type & style
- Home type: SingleFamily
- Property subtype: Single Family Residence
Condition
- New construction: No
- Year built: 1994
Utilities & green energy
- Sewer: Public Sewer
- Water: Private
Community & HOA
Community
- Features: Suburban
Location
- Region: Adelanto
Financial & listing details
- Price per square foot: $273/sqft
- Tax assessed value: $67,828
- Date on market: 11/14/2026
- Cumulative days on market: 8 days
- Listing terms: Submit
Estimated market value
$346,400
$329,000 - $364,000
Not available
Price history
| Date | Event | Price |
|---|---|---|
| 11/15/2026 | Listed for sale | $345,000+538.9%$273/sqft |
Source:  CRMLS #IG26243857 Report a problem | ||
| 11/5/2026 | Listed for rent | $2,100+10.5%$2/sqft |
Source: Zillow Rentals Report a problem | ||
| 1/18/2022 | Listing removed | -- |
Source: Zillow Rental Manager Report a problem | ||
| 1/8/2022 | Listed for rent | $1,900+130.3%$2/sqft |
Source: Zillow Rental Manager Report a problem | ||
| 8/26/2014 | Listing removed | $825$1/sqft |
Source: Century 21 Beachside Realtors #445075 Report a problem | ||
| 7/31/2013 | Price change | $825-5.7%$1/sqft |
Source: Century 21 Beachside Realtors #431087 Report a problem | ||
| 7/9/2013 | Listed for rent | $875$1/sqft |
Source: Century 21 Beachside Realtors #431087 Report a problem | ||
| 4/17/2012 | Sold | $54,000-16.8%$43/sqft |
Source: Public Record Report a problem | ||
| 3/2/2012 | Price change | $64,900-8.5%$51/sqft |
Source: CENTURY 21 Desert Rock #411420 Report a problem | ||
| 1/31/2012 | Price change | $70,900-5.3%$56/sqft |
Source: CENTURY 21 Desert Rock #411420 Report a problem | ||
| 12/29/2011 | Listed for sale | $74,900+66.7%$59/sqft |
Source: foreclosure.com Report a problem | ||
| 10/19/2011 | Sold | $44,942-35.8%$36/sqft |
Source: Public Record Report a problem | ||
| 12/30/2010 | Listing removed | $70,000$55/sqft |
Source: MARIO GARCIA #146904951 Report a problem | ||
| 10/30/2010 | Price change | $70,000-8.5%$55/sqft |
Source: MARIO GARCIA #146904951 Report a problem | ||
| 9/12/2010 | Listed for sale | $76,500-3.2%$60/sqft |
Source: MARIO GARCIA #146904951 Report a problem | ||
| 3/13/2001 | Sold | $79,000+62.9%$62/sqft |
Source: Public Record Report a problem | ||
| 11/17/2000 | Sold | $48,500-43.7%$38/sqft |
Source: Public Record Report a problem | ||
| 4/28/2000 | Sold | $86,148+4.4%$68/sqft |
Source: Public Record Report a problem | ||
| 12/6/1994 | Sold | $82,500$65/sqft |
Source: Public Record Report a problem | ||
Public tax history
| Year | Property taxes | Tax assessment |
|---|---|---|
| 2026 | -- | $67,828 +2% |
| 2025 | $1,273 +9.6% | $66,498 +2% |
| 2024 | $1,161 -3.5% | $65,194 +2% |
| 2023 | $1,204 +9.2% | $63,916 +2% |
| 2022 | $1,103 -3.7% | $62,662 +2% |
| 2021 | $1,145 +3.2% | $61,433 +1% |
| 2020 | $1,109 +1.1% | $60,803 +2% |
| 2019 | $1,097 +1% | $59,611 +2% |
| 2018 | $1,086 +3.6% | $58,442 +2% |
| 2017 | $1,048 | $57,296 +2% |
| 2016 | $1,048 +2% | $56,172 +1.5% |
| 2015 | $1,027 +4.6% | $55,329 +2% |
| 2014 | $982 | $54,245 +0.5% |
| 2013 | -- | $54,000 -16.9% |
| 2012 | -- | $65,000 +12.1% |
| 2011 | -- | $58,000 |
| 2010 | -- | $58,000 |
| 2009 | -- | $58,000 -35.9% |
| 2008 | -- | $90,514 +2% |
| 2007 | -- | $88,739 +2% |
| 2006 | -- | $86,999 +2% |
| 2005 | -- | $85,293 +2% |
| 2004 | -- | $83,621 +1.9% |
| 2003 | -- | $82,088 +2% |
| 2002 | -- | $80,478 +65.9% |
| 2001 | -- | $48,500 -45.9% |
| 2000 | -- | $89,684 |
Find assessor info on the county website
Monthly payment
Est. payment
Payment breakdown
Explore the cost of this home by adjusting the details. Changes won't be saved.Climate risks
Neighborhood: 92301

Similar homes
- $369,9003 bd2 ba1k sqft17823 Bridgeport St, Adelanto, CA 92301For Sale
 MLS ID #TR26244294, Oscar Jin Zhang, Homequest Real Estate. CRMLS
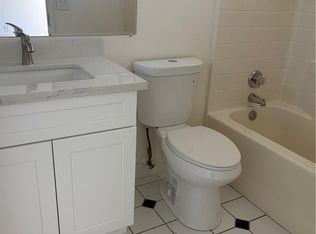
- $350,0003 bd2 ba1k sqft17743 Carson Cir, Adelanto, CA 92301For Sale
 MLS ID #CV26224615, Terrance McMillan, Coldwell Banker Envision. CRMLS
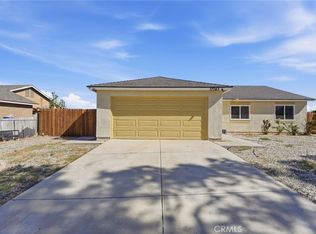
- $329,9003 bd2 ba1k sqft17851 Crowley St, Adelanto, CA 92301For Sale
 MLS ID #HD26146559, Juan Rivera, Realty ONE Group Empire. CRMLS
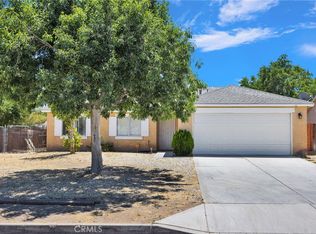
- $365,0004 bd2 ba1.2k sqft17956 Kendall Cir, Adelanto, CA 92301For Sale
 MLS ID #IV26168902, SONIA OROZCO, EXP REALTY OF SOUTHERN CALIFORNIA INC.. CRMLS
